Profit and Loss
An overview of how profit and loss are calculated and displayed on the bot dashboard.
The bot dashboard shows the lifetime position metrics for a bot. The daily P&L chart requires at least 3 data points, i.e., 3 closing values on the portfolio across 3 market days before a graph is displayed. The active profit and loss value is updated each time the page is refreshed. The Activity Window will summarizes all bot activity.
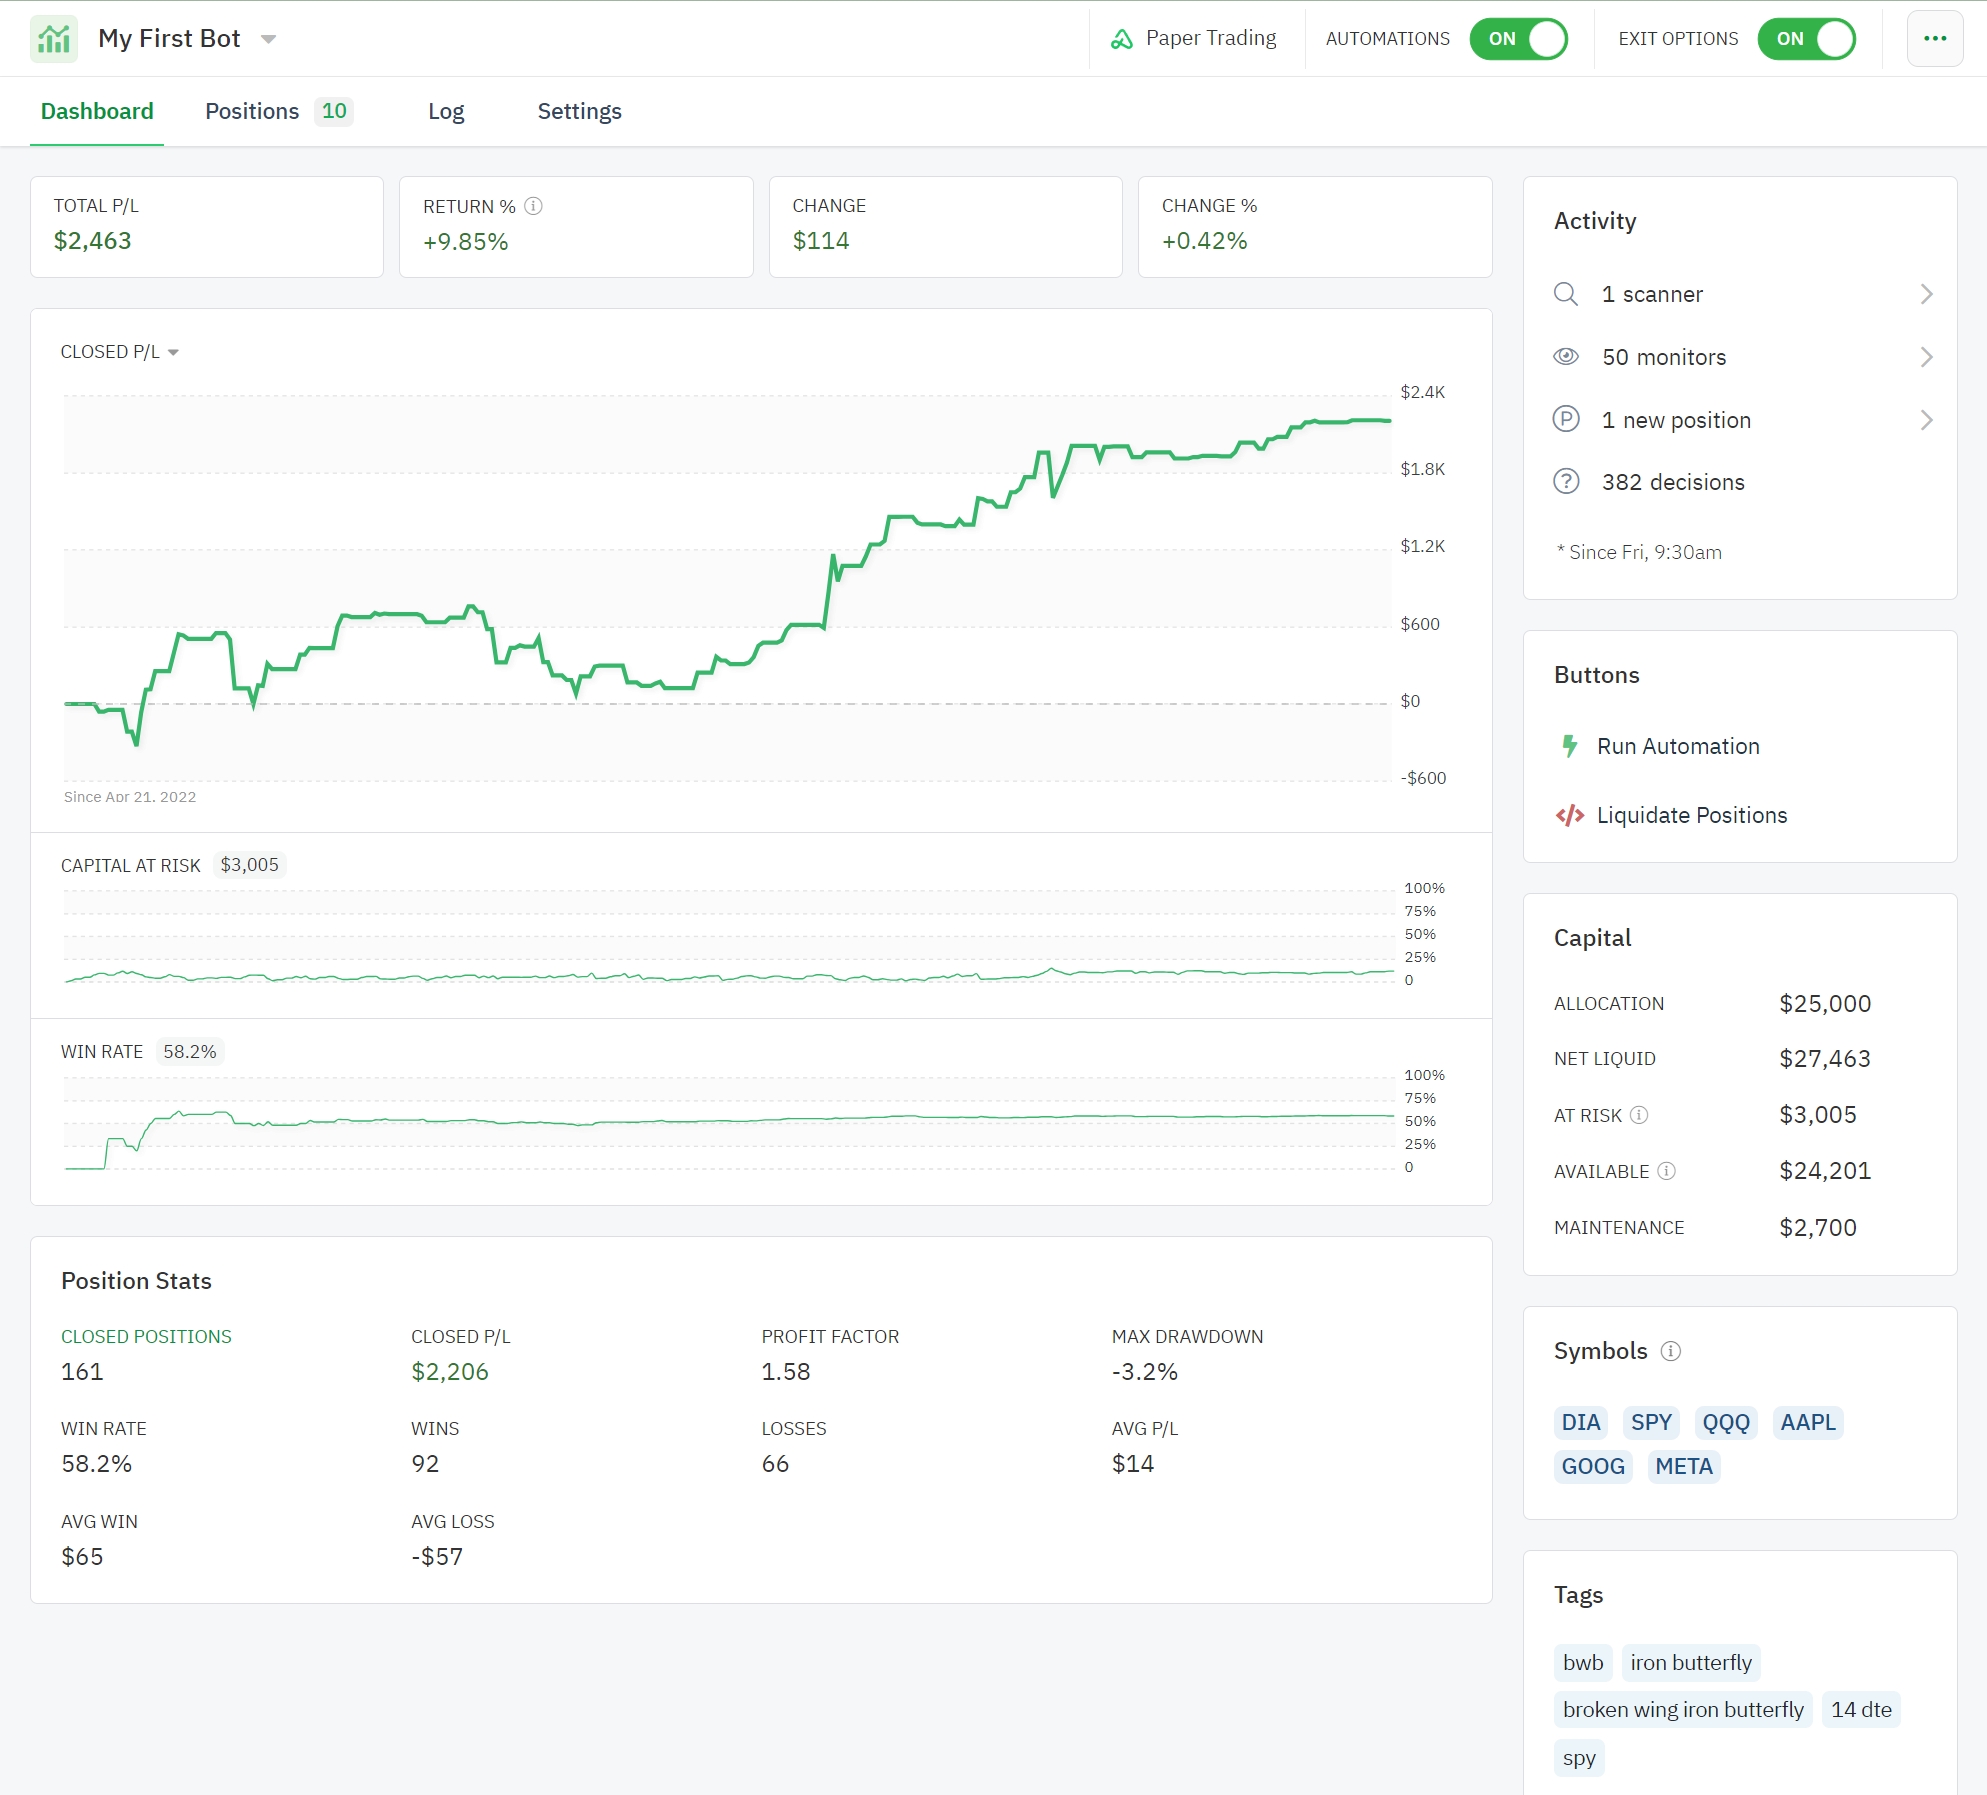
All End-of-Day profit and loss calculations are settled daily at 4:15 Eastern Time (ET) During the 15-minute period after the close, bid/ask spreads can become extremely wide which will cause the Daily P/L on your bot dashboard to become skewed. Do not panic!
Activity Window
The activity window provides a snapshot overview of the total count for bot automations and decisions along with daily counts for open and closed positions. In addition, any tickers that have been referenced and any warnings or errors are also shown on a daily basis.
Warnings and errors will be cleared and reset prior to the market opening the following day.
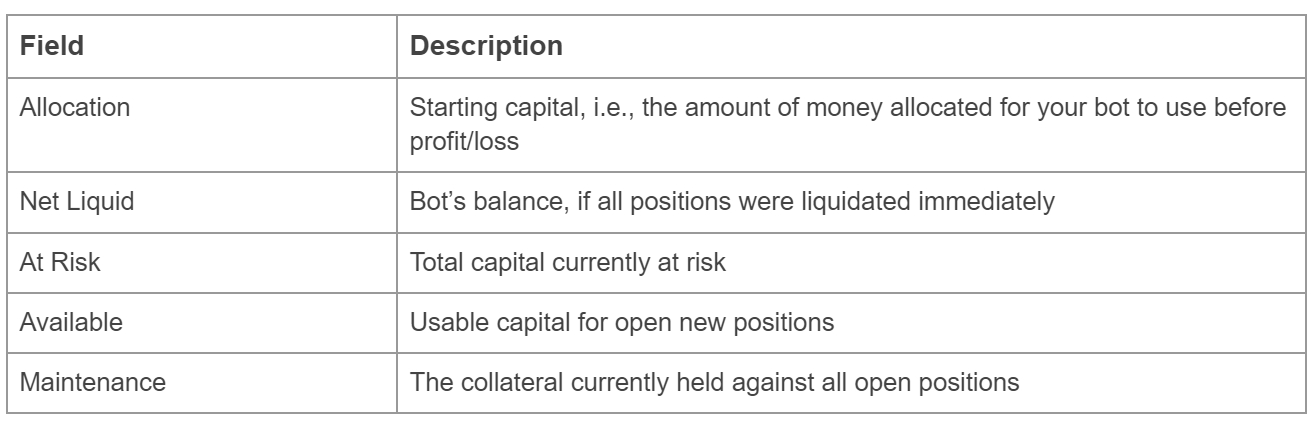
Available Capital (Example)
Assume a new bot is allocated $2,500 capital.
1) The bot opens a $5 wide short put spread and receives $1.75 ($175) credit.
2) Another $5 wide short put spread opens for a $1.50 ($150) credit.
The bot now has $2,825 in capital (original allocation $2,500 + $175 + $150). Both short put spread have a $500 maintenance. The total maintenance requirement for the open positions is $1,000.
$2,825 - $1,000 = $1,825. The $1,825 is the available capital.
The Available Capital calculation includes pending orders to prevent exceeding max allocation.
Performance Metrics
Total P/L & Return %
The active profit and loss value is updated each time the page is refreshed and is the total of both active and closed positions (realized and unrealized gains or losses).
Return on investment measures the effectiveness of an investment relative to its initial cost of entry. ROI divides the return of an investment by the cost of the investment.
For example, if an investment cost $5,000 to purchase and is now worth $6,000, the ROI for the investment is 20% ($6,000-$5,000 = $1,000 / $5,000).
Change & Change %
The Change P/L and Change % measure the change in P/L from yesterday. Change % is the change in P/L between yesterday and today divided by yesterday's bot "value" (the total worth of the bot, including open positions). When the bot has no previous day's value that can be used, the allocation is used to provide a starting value.
Win Rate
The win rate divides the total number of winning trades by total trades. For example, if an investor has placed 200 trades and has realized a profit on 120 of them, the win rate is 60% (120/200).
While the win rate can identify how successful trades are at generating profit, it is not as important as the profit factor or how much is gained or lost on each trade. For example, an investor may have a 60%-win rate, but if they lose 3x as much when they lose as they make when they win, they will still lose capital over time.
Profit Factor
The profit factor divides the total amount of money gained by the total amount of money lost. Profit factor is important when used in conjunction with the win rate because it creates a more complete view of trading performance.
For example, if an investor has placed 200 trades with a win rate of 60% and averages $50 per winning trade and $50 per losing trade, their profit factor will be 1.5 with a net profit of $2000 ((120 x $50 = $6,000) / (80 x $50 = $4,000)).
Compare this with an investor who has a 60%-win rate on 200 trades but a profit factor of .5 because they average $50 per winning trade, but $150 per losing trade ((120 x $50 = $6,000) / (80 x $150 = $12,000)). They will have a net loss of -$6,000, despite the same win rate.
Max Drawdown
Maximum drawdown is a measure of the greatest fall in value from the peak high point to the lowest point before a new peak is achieved. This is also displayed as a percentage to further help identify how drastic of a peak to valley drawdown has been experienced over the course of the charted performance graph.
If the bot's P/L value does not cross below 0, the performance graph will use 0 as the low point anchor and only display a maximum peak value alongside the current P/L value.
Averages
Avg P/L is the average gain or loss for all closed positions. (Closed P/L ÷ Closed positions).
Avg Win is the average gain for all winning positions. (Closed P/L of winning trades ÷ Number of winning trades)
Avg Loss is the average loss for all losing positions. (Closed P/L of losing trades ÷ Number of losing trades)
Position Value
The position "value" is a function of the currentPrice of a share or contract multiplied by the number of contracts, where the currentPrice is synonymous with the matched opportunity mark. Each Position is tracked as a combination of legs, where each leg has/is a security object. Every time we quote the Position, we build an opportunity out of all of the position legs and compare it to the saved values for where the Position opened to provide an accurate quote. For example, if we have a 425/400 short put spread and we want to know the P/L, we pull quotes for the 425 put and 400 put independently and then combine them into a short put spread opportunity. This provides the value X of this short put spread right now and now subtract the value of the original position, Y, from X, and that's the P/L.
To obtain the total open P/L, sum the resultant values for every open position.
Differences between Option Alpha and Broker P/L
It's important to note that the P/L displayed on the Option Alpha platform may differ from what is shown on your brokerage platform or statements. In this article, we'll explore the reasons that may cause traders to notice a difference when comparing P/L on Option Alpha and their brokerage platform. Option Alpha receives order IDs and fill prices directly from the broker. While this data exchange ensures accuracy, it is essential for traders to cross-reference this information with their broker's platform to ensure consistency.
Valuation Methodology
One significant distinction lies in how Option Alpha and brokers evaluate the value of positions. Option Alpha values all positions based on the mid price of the entire position. In contrast, brokers often evaluate individual legs using the Last trade price. This difference exists because brokerage platforms allow traders to manage legs individually or together.
Option Alpha justifies the use of the mid price as the best representation of a position's value as that represents a likely exit price, making it a more accurate measure of its potential value. By avoiding reliance on the Last trade price of any one leg, Option Alpha ensures that individual leg prices don't throw off the overall evaluation.
Wash Sale Rule and Accounting Methods
Broker statements might reflect the Wash Sale rule in effect, which disallows the immediate repurchase of a security after selling it at a loss for tax purposes. This can lead to variations in P/L calculations between Option Alpha and brokerage platforms.
Exclusion of Commissions and Fees
Option Alpha does not include any commission or exchange fees in its P/L calculations. This approach simplifies the assessment of a position's performance and allows traders to focus solely on the market movement impact. Although generally only a few cents per trade, exchange and transactional fees can add up over time and create a noticeable difference when comparing P/L.
Each broker has their own fee schedule, which you can reference for an overview of any associated fees.
Understanding the Change Column
On the Bots homepage of Option Alpha, the Change column represents the change in a position's value from one day to the next. It does not reflect the actual value of the position. For example, if a position’s value was $100 at market close yesterday and is now valued at $200, the Change column will display the difference, which is $100. This is not the same as a Day P/L or Open P/L column that you may see on the broker platform, which is showing you the value of positions today only, and not the day-to-day change. Additionally, the Change column from the main Bots page will include the Change of any closed positions today. This makes it common for the two Change column values to be different from one another. One viewpoint reflects all change, including closed positions, the other is only active open positions.
After hours pricing
The most common discrepancy is caused by after-hours pricing. When the market closes, the spread prices of the underlying position widen out, which causes wild misrepresentations of the position's value. Upon the market reopening the following day, the values, and underlying spreads come back into normal alignment. If you are looking at positions outside of normal market hours, do not be alarmed if your position value is not what you expect.
Overridden Positions
As mentioned in our Order Handling page, the most common reason for differences between the two platforms is due to overridden In The Money positions that were released before expiration by our Option Expiration Protocol. Be sure to keep an eye on your expiring positions and if you intend to let In The Money positions expire, update the closed value based on the settlement price reflected in your brokerage account.
Last updated
Was this helpful?