# Welcome

Welcome to the Option Alpha Docs. Inside is everything you need to start trading with Option Alpha, including detailed guides, video tutorials, technical documentation, and FAQs.

{% hint style="info" icon="play" %}

<p align="center">Don't have an Option Alpha account yet? Start your 30-day FREE trial: <a href="https://app.optionalpha.com/login" class="button primary">Start Free Trial</a></p>
{% endhint %}

<table data-card-size="large" data-view="cards"><thead><tr><th></th><th data-hidden data-card-target data-type="content-ref"></th><th data-hidden data-card-cover data-type="image">Cover image</th></tr></thead><tbody><tr><td><strong>Intro to Option Alpha</strong></td><td><a href="/pages/-MYjly5YRDdSz4VbXAX7">/pages/-MYjly5YRDdSz4VbXAX7</a></td><td><a href="/files/ZDB7lugn3g0yJ1fqKXzW">/files/ZDB7lugn3g0yJ1fqKXzW</a></td></tr><tr><td><strong>Getting Started</strong></td><td><a href="/pages/iDYKKjmdHZQNk1wYxTWI">/pages/iDYKKjmdHZQNk1wYxTWI</a></td><td><a href="/files/StvZ4uf35PTXnKPBZIXG">/files/StvZ4uf35PTXnKPBZIXG</a></td></tr><tr><td><strong>Bots</strong></td><td><a href="/pages/0JeRFq9mGOAGo7g1gF73">/pages/0JeRFq9mGOAGo7g1gF73</a></td><td><a href="/files/4LiwyQU9HlEXZcvzsqxr">/files/4LiwyQU9HlEXZcvzsqxr</a></td></tr><tr><td><strong>Finding Trades</strong></td><td><a href="/pages/rdrw2rL1z6YSFUd3aMVj">/pages/rdrw2rL1z6YSFUd3aMVj</a></td><td><a href="/files/iPa39m5jJMPLCubtMpRk">/files/iPa39m5jJMPLCubtMpRk</a></td></tr><tr><td><strong>Backtesting</strong></td><td><a href="/pages/RQIvCerjsaW1z1rSGTgs">/pages/RQIvCerjsaW1z1rSGTgs</a></td><td><a href="/files/7kX70Scyj3vRcU1hzeDv">/files/7kX70Scyj3vRcU1hzeDv</a></td></tr><tr><td><strong>Managing Positions</strong></td><td><a href="/pages/ztujiQCefFSSNDCTrIkn">/pages/ztujiQCefFSSNDCTrIkn</a></td><td><a href="/files/9rTdDAL5OwYmdglgaPH1">/files/9rTdDAL5OwYmdglgaPH1</a></td></tr><tr><td><strong>Clone Bot Templates</strong></td><td><a href="/pages/TpdUACM1d10l9CGBIFzc">/pages/TpdUACM1d10l9CGBIFzc</a></td><td><a href="/files/fKScd2WFePIwXY4EDiHA">/files/fKScd2WFePIwXY4EDiHA</a></td></tr><tr><td>Platform Tech Docs</td><td><a href="/pages/Kol1CSGVYkxeJZEUpiI6">/pages/Kol1CSGVYkxeJZEUpiI6</a></td><td><a href="/files/ec1yC1mSqRLgna0PPO0D">/files/ec1yC1mSqRLgna0PPO0D</a></td></tr><tr><td>Calculations</td><td><a href="/pages/AvZvUNuTTkoFxcf9mILN">/pages/AvZvUNuTTkoFxcf9mILN</a></td><td><a href="/files/gjyIKS40dwsnphQs0Cx2">/files/gjyIKS40dwsnphQs0Cx2</a></td></tr><tr><td>Platform Indicators</td><td><a href="/pages/dFlf08h653hDfFra05RX">/pages/dFlf08h653hDfFra05RX</a></td><td><a href="/files/f6eVASn3L2qOBckyAu3k">/files/f6eVASn3L2qOBckyAu3k</a></td></tr></tbody></table>


# Intro to Option Alpha

Welcome to the Option Alpha help docs. New to bots and autotrading? This is the best place to get started.

### Find Opportunities. Backtest Ideas. Automate Strategies.

#### Find Trades

* Use [Trade Ideas](https://app.optionalpha.com/tradeideas) to "shop" for trades with a positive expected value (EV)
* Scan for [0DTE trades](https://app.optionalpha.com/zdte) by backtesting position metrics against historical price movements
* [Screen](https://app.optionalpha.com/screener) for new symbols by options liquidity, technical indicators, momentum and more
* Innovative [Research Reports](https://app.optionalpha.com/research) updated nightly
* Find backtested earnings trades with [Earnings Edge](https://app.optionalpha.com/earnedge)

#### Backtesting

* [Backtest](https://app.optionalpha.com/zdte/backtester) a strategy to fine tune for maximum profits
* Search [Top Backtests](https://app.optionalpha.com/zdte/backtester/toptests) to find a new strategy

#### Automation

* Use bot [automations](/tools/bots/automations) to find, open, and manage positions that match your entry criteria
* Use [Exit Options](/tools/managing-positions/exit-options) to monitor and close positions when your exit criteria are met
* Leverage [SmartPricing](/tools/bots/smartpricing) to get trades filled at the best available price

#### Learn From Other Traders

* Explore the [Top Bot Templates](https://app.optionalpha.com/community/toptpls) in the OA community
* See the [Top Strategies](https://app.optionalpha.com/topstrategies) other traders are using to find success
* Get help and learn from the collective knowledge of the [OA community](https://app.optionalpha.com/community)

## Why Bots

Bots are like a trading assistants that perform trading tasks for you. Bots are consistent, emotionless and systematic. Bots can do many things including:

* Scan for new positions that match your entry criteria
* Initiate trades to open positions when they are available
* Place multiple orders between the bid/ask spread to get trades filled at the best possible price
* Monitor positions waiting for predefined exit conditions

Combine all of these to execute a fully automated trading strategy.

#### Automations

Your bot can use market data and indicators to make decisions, open and close positions, send you notifications and much more. Automations are the instructions you add to your bot that define the actions you want it to perform:

<div align="left"><figure><img src="/files/rOTC9Z6vFRiMWSTJcQH2" alt=""><figcaption></figcaption></figure></div>

Automations can be scheduled to run continuously every 1 minute, based on a repeating schedule, when you click a button, and many more options:

<div align="left"><figure><img src="/files/sy0PYAaGWq1itI1p0Lfz" alt="" width="563"><figcaption></figcaption></figure></div>

#### Scanning for Positions

For example, add a scanner automation to your bot to watch for specific entry conditions and automatically open a position when it's available:

<div align="left"><figure><img src="/files/wslqh7dhrVn1QzMzVvHK" alt=""><figcaption></figcaption></figure></div>

#### Monitoring and Exiting Positions

After your bot opens a position, it will monitor the position every 1 minute checking for your predefined exit criteria:

<div align="left"><figure><img src="/files/bYG9OVNFAEWQx6mms6II" alt="" width="563"><figcaption></figcaption></figure></div>

You can also add a monitor automation to your bot that checks for more specific exit conditions:

<div align="left"><figure><img src="/files/S7ZiKRMetUTJu8J4DLzd" alt=""><figcaption></figcaption></figure></div>

#### Transparency

Everything the bot does is logged with full transparency. No black box here! Your bot's log has details of what happened each time an automation runs:

<div align="left"><figure><img src="/files/DEz8CfMFvs4nvjhNziIm" alt=""><figcaption></figcaption></figure></div>

Including the actions executed in the automation:

<div align="left"><figure><img src="/files/e5IRyjScGfwzARaWuMHX" alt="" width="563"><figcaption></figcaption></figure></div>

You can even inspect the exact data the bot used when making decisions:

<div align="left"><figure><img src="/files/fUcizOuhwT5IwyMiBpa2" alt="" width="563"><figcaption></figcaption></figure></div>

and opening positions:

<div align="left"><figure><img src="/files/u5w5cqewJk3ZMiW779Xu" alt="" width="563"><figcaption></figcaption></figure></div>

#### Profit and Loss

Your bot logs the profit and loss for all of its positions so you can keep track of it's profitability:

<div align="left"><figure><img src="/files/DWZAsdFoyYn3h1i8uEQb" alt=""><figcaption></figcaption></figure></div>

## Fully Automated Example Bots

The bot templates below include a step-by-step video showing how to set up a bot from scratch to find, open and manage positions automatically:

<table data-card-size="large" data-view="cards"><thead><tr><th></th><th></th><th data-hidden data-card-target data-type="content-ref"></th><th data-hidden data-card-cover data-type="image">Cover image</th></tr></thead><tbody><tr><td><mark style="color:blue;"><strong>WiFly 1DTE $60 Wide</strong></mark></td><td>Daily SPX 1DTE iron butterfly managed at 15%</td><td><a href="https://app.optionalpha.com/community/member/jackslocum/post/wifly-1dte-60-wide">https://app.optionalpha.com/community/member/jackslocum/post/wifly-1dte-60-wide</a></td><td data-object-fit="contain"><a href="/files/q1iCH8YD9uLiOU1gTeTr">/files/q1iCH8YD9uLiOU1gTeTr</a></td></tr><tr><td><mark style="color:blue;"><strong>Auto Ideas - ETFs</strong></mark></td><td>Cherry picks credit spreads with favorable metrics from Trade Ideas</td><td><a href="https://app.optionalpha.com/community/member/jackslocum/post/auto-ideas-etfs">https://app.optionalpha.com/community/member/jackslocum/post/auto-ideas-etfs</a></td><td data-object-fit="contain"><a href="/files/D8RelXaVMeAmNQAcvLuP">/files/D8RelXaVMeAmNQAcvLuP</a></td></tr><tr><td><mark style="color:blue;"><strong>Peggie Bank</strong></mark></td><td>SPX 0DTE bot based on intraday price "pegging" research located in OA Labs</td><td><a href="https://app.optionalpha.com/community/member/jackslocum/post/peggie-bank">https://app.optionalpha.com/community/member/jackslocum/post/peggie-bank</a></td><td data-object-fit="contain"><a href="/files/Xf1Pg2B7wM8khHyolPiw">/files/Xf1Pg2B7wM8khHyolPiw</a></td></tr><tr><td><mark style="color:blue;"><strong>Rev Ninja ETFs</strong></mark></td><td>Simple RSI based mean reversion strategy + Trade Ideas</td><td><a href="https://app.optionalpha.com/community/member/jackslocum/post/rev-ninja-etfs">https://app.optionalpha.com/community/member/jackslocum/post/rev-ninja-etfs</a></td><td data-object-fit="contain"><a href="/files/2BFIXrqG1GZMMXNi7vlr">/files/2BFIXrqG1GZMMXNi7vlr</a></td></tr></tbody></table>

## New Ways To Find Trading Opportunities

Option Alpha provides several innovative ways for finding new trades, each tool designed to provide insights for a specific trading opportunity available to options traders...

### [Trade Ideas](broken://pages/KKpoHTAbu5W6THkf3q1c)

Finds trades with an edge based on EV and probabilities.

The Trade Ideas backend scans continuously during market hours (9:35 am - 3:55 pm) and finds trade ideas in 3 ways:

* Analyzes the top-performing position setups used by all traders in the platform.
* Analyzes every option series expiring in 45 days or less that falls on a Friday and matches up every possible combination of legs at common delta values.
* It examines all current open positions in the platform that are looking for opportunities.

<div align="left"><figure><img src="/files/0c6M5qWTjCg4J4X2R7Dn" alt=""><figcaption></figcaption></figure></div>

### [0DTE Oracle](broken://pages/amyfya6ntiwdR6ffuATs)

Find and analyze 0DTE and next-day trading opportunities.

It aims to solve the problem of probabilities and expected value (EV) being less accurate for 0DTE trades by providing backtest results to help us identify quality trades instead of relying on probabilities.

Each trade's metrics are backtested against the underlying's previous 1 year of intraday minute data to see how trading a similar position daily would have performed over that time.

<div align="left"><figure><img src="/files/rGYtuPHN62kaPJyZW7nL" alt=""><figcaption></figcaption></figure></div>


# Getting Started

Discover how to get started with Option Alpha bots.

### What is a bot?

Bots are like assistants that help with trading options. In Option Alpha, all trades and automated logic are performed by bots.

Traders tend to repeat activities. For example, scanning symbols and watchlists looking for trading opportunities. When you find a potential opportunity, you analyze data, make a series of decisions, and start opening a new position. After that, you monitor your positions, checking for profit and loss targets, watching for changes in indicators, trends, or momentum, and dozens of other things as you manage your trades.

These are activities traders do over and over.

Option Alpha’s bots follow instructions and do exactly what I tell them to do, automating all the decisions, and take the necessary actions of my trading plan that I would otherwise have to perform manually.

This means instead of being forced to remember (and have the time to make) all the decisions, bots can run entire trading strategies for me, from start to finish, with consistency, speed, and efficiency.

### Setting up your bot

To create a new bot, select “Create Bot” from the Bots homepage. Then, define the bot’s settings and safeguards.

* Bot Name and Icon - The name and custom icon you give it (have fun).
* Choose an account - Your paper trading account uses live market data, so you can run your bots risk-free. When you're ready, connect a brokerage account to send your orders to your broker for execution.
* Allocation - Tells the bot how much of your trading capital it can use to open positions.
* Position Limits - The maximum number of positions a bot can open in a day and in total.

Defining capital and position limits lets you safely allocate capital between different trading strategies.​

<figure><img src="/files/VxgGOZiIY1v3CV6UzxrB" alt=""><figcaption></figcaption></figure>

### Adding automations

Trading involves countless repetitive tasks done over and over.&#x20;

Automations efficiently execute those activities for me.​Automations are the instruction manual for a bot that tell it what to do and when. Bot automations move through a framework of decision criteria in a logical progression. You can build automations to run continuously, on a defined schedule, or at the push of a button. There are two automation types:

* Scanners - scan for new opportunities
* Monitors - manage existing positions

Automations include decision recipes. Decision recipes are the set of instructions a bot follows to determine yes and no answers. For example, the bot can check if a ticker symbol is above or below a moving average, what the IV rank is, when expiration is, and much more. There are dozens of recipes to choose from.​

<figure><img src="/files/kziNIbfWCbHYYv1RS8rx" alt=""><figcaption></figcaption></figure>

Automations can be as simple or complex as you like. They can be saved and organized with folders in your Automation Library. You can reuse an automation in as many bots as you want. Reusing an automation saves you the time of recreating the entire strategy.

You can edit automations at any time. Changing an automation applies the changes to every bot using the automation. You can copy an automation if you want to make changes but preserve the original. Copies let you modify the automation’s actions without affecting the original automation.

Reusing automations is a time saver that significantly increases the scalability of autotrading. Many traders use different tickers with different criteria. No problem. Enter custom inputs.

Inputs are dynamic tools used in decision recipes across different bots and automations to give you added flexibility. Custom inputs allow you to manually input variable fields, such as the ticker symbol or numerical values, and link fields together within an automation.

### Scanning for trades

Trading used to involve scanning watchlists for opportunities, analyzing data, making decisions, and then opening new positions. Now, I use scanner automations to offload those tasks so that I can focus on strategic thinking.

Scanner automations run on defined time intervals and look for opportunities to enter new positions based on the decision recipes I choose. For example, if a bot’s objective is to sell a put credit spread when a security is above a long-term moving average, a scanner can do just that. Scanners look for opportunities as long as there is room within the bot’s allocation and position limits.

Select the “Settings” tab in your bot's dashboard and choose the “+ Add Automation” to create a new automation and access the automation editor. To start adding instructions to our automation, we’ll select the “+” icon at the top of the editor.

The automation editor is where you tell the bot what decision to make and/or what actions to take. It follows “Yes” and “No” paths in a step-by-step format as it moves through your bot’s decisions or takes actions. To start adding instructions to the automation, select the “+” icon.

* Create a New Scanner Automation - Name the automation, and save it to the library.
* Use a symbol loop to create your custom watchlist.
* Add Decisions - There are dozens of different decision actions available with limitless customization options. Decisions are often used at the beginning of a scanner automation so the bot can filter through specific market data before entering a position. You can add as many decisions as you like down both the “Yes” and “No” paths of the automation editor.
* Add an Open Position Action - Select a position type, customize the position to fit the strategy, define your position sizing, and set the SmartPricing criteria.

<figure><img src="/files/2VY7DlqhMidqyGYzDNmL" alt=""><figcaption></figcaption></figure>

### Customize SmartPricing

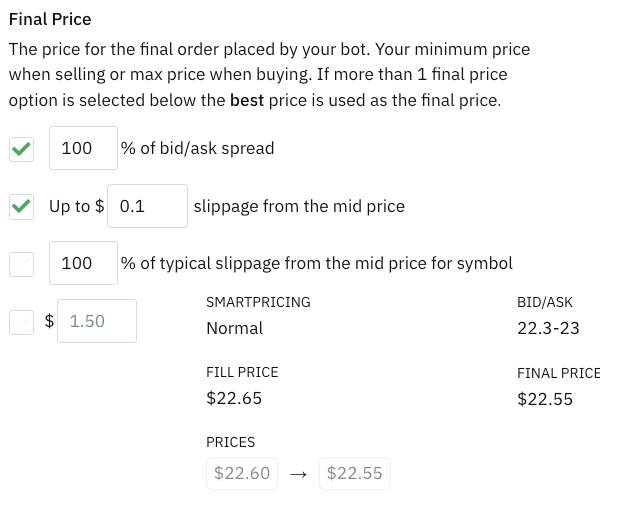
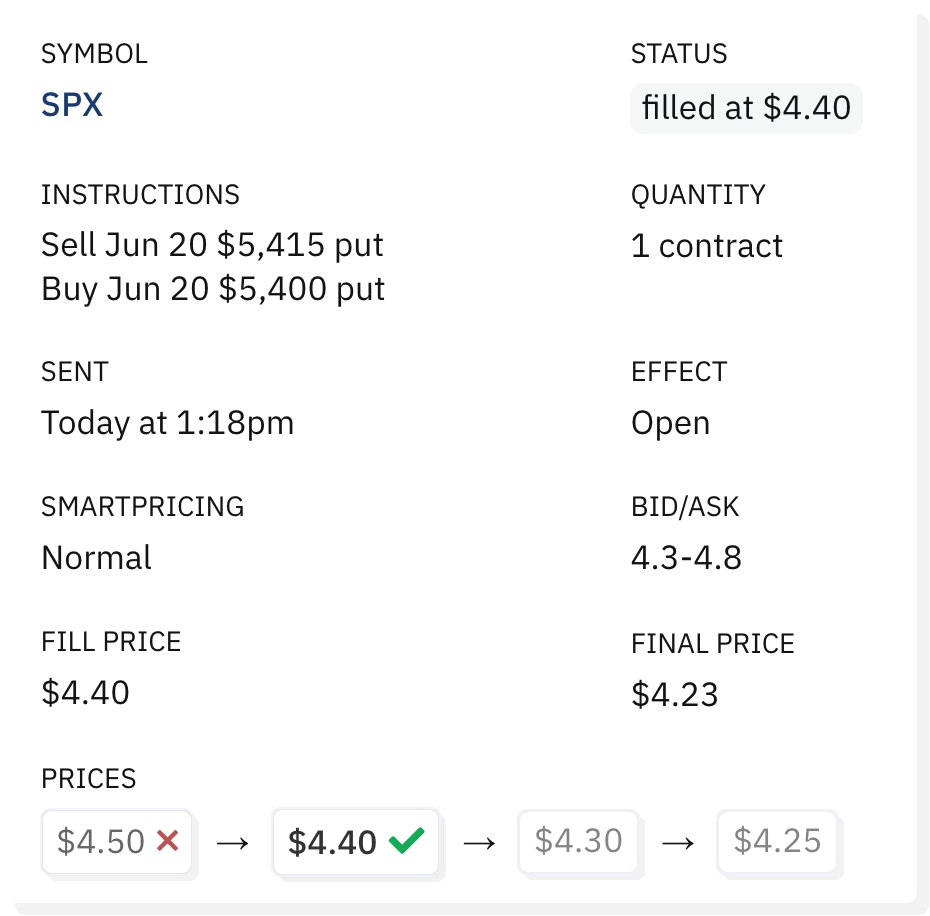
Option Alpha’s proprietary SmartPricing technology places timed limit orders in a sequence, starting near the mid-price, and traverses the bid-ask spread until you reach your final price. You can even customize how far you'll let SmartPricing work beyond the mid-price to avoid costly slippage.

Simply said: it finds the best possible price for your order so you don't have to cancel and replace orders manually. SmartPricing orders automatically cancel after two minutes if not filled.

By default, order pricing is set to Normal SmartPricing and 100% of the bid/ask spread. There are four different SmartPricing settings that you can customize:

* Normal - Works through up to 4 prices, 10 seconds each.‍
* Fast - Works through up to 3 prices, 5 seconds each.‍
* Patient - Works through up to 5 prices, 20 seconds each.‍
* Off - You can always turn off SmartPricing and a limit order will be sent to your broker at 100% of the bid/ask spread or a final price you set. ‍
* Market - Send a market order for immediate execution. Be aware that market orders can fill at a price well beyond the listed bid-ask spread.

<figure><img src="/files/0nvMe2W2VNtUG82z9SSn" alt=""><figcaption></figcaption></figure>

Remember, you are in complete control of your bots. You tell the bot when to turn on, what to look for, when to open positions, when to exit positions, and much more. Next, we’ll tell the bot how to exit positions.

### Monitoring positions

Once you've opened a new position, you have to manage it!

Different traders manage positions using different management styles. Sometimes, even the same trader manages different types of strategies with different management styles.

Before autotrading, I would set profit and loss targets or create alerts to help manage positions. Or, sometimes, I would sit in front of the screens watching the price action and looking for the right time to get out of the position.

With bots, the process is much simpler. Monitor automations manage positions. An army of bots could watch 200 different positions (or more!) with ease. Monitors continuously watch open positions and look to exit or adjust them based on my decision criteria. Like scanner automations, monitors run on defined time intervals.

To create a new monitor automation, select “+ Add Automation” in the bot's Settings.

* Create a New Monitor Automation - Name the automation, and save it to the library.
* Add a Position Loop- These tell the monitor to loop through the same actions for all positions of a certain type. Loops make it incredibly efficient to manage multiple positions.
* Add Decisions - Remember, there are dozens of different decisions available, so the sky is the limit for what you can create!SmartStopsis just one example of a decision you can use in a Monitor Automation. SmartStops trail a position once a profit target is hit, and could help you get more out of your positions.
* Add a Close Position Action - Set your SmartPricing criteria and exit the trade.

<figure><img src="/files/ig9l8tEnMKgbZzeNCTAq" alt=""><figcaption></figcaption></figure>

Monitors only run if there’s an open position. Monitor automations can be as simple or complex as you like and designed to monitor different position types, multiple underlying securities, or all positions within a bot.

With Exit Options, you can pre-set your exit parameters and automate position management every minute of the trading day. Exit Options monitor your positions every minute and will automatically close the position when your criteria are met.

Plus, you can use 1-minute trailing stops for ultimate control (including custom safeguards to combat price fluctuations and protect against slippage).

We know it's overwhelming to manage all your positions, tracking returns, expiration, earnings, and manually inputting orders over and over.

You can customize each position's Exit Options management with five triggers:

* Profit
* TakingTrailing
* StopStop Loss
* Before Expiration
* Before Earnings

<figure><img src="/files/VPxDFxqoZA97WtQ5oNrI" alt=""><figcaption></figcaption></figure>

### Event-based automation triggers

Events convert scheduled, predetermined tasks we already do manually into automated actions. Whether it is dollar-cost averaging, laddering entries, or opening and closing positions at specific times each week, I repeat a lot of activities on a regular basis. Event automations take those repetitive actions and systemically implement them for me.

Unlike scanner and monitor automations, which continuously manage positions at defined intervals, you can trigger events for specific dates and times, run as a contingency when another position is opened or closed, or run immediately at the click of a button.

There are multiple triggers you can use to schedule automations:

* On a Specific Date - You can run an event on a specific date or time in the future. For example, if you wanted to enter a position on the first trading day of every month, you could schedule it with an event automation.
* On a Repeating Schedule - You can run an automation on a repeating schedule. For example, you can schedule an automation to run every Monday and Friday at 3:00 p.m.
* Open New Position and Close Position - An automation is triggered to run one time if a new position is opened or an existing position is closed.
* At Market Open or Market Close - Automatically run an automation 10 minutes after the market opens or 10 minutes before the market closes. Perfect for checking market conditions, re-setting bot tags, or checking for profits at the end of the day.
* Buttons - Buttons are events that run an automation at the click of a button. Any time the button is clicked, it will immediately run the automation. Customized buttons can be created for any scanner or monitor automation and added to the bot dashboard.

<figure><img src="/files/bIdZOyik5PMYGPUMMDXh" alt=""><figcaption></figcaption></figure>

Event automations add flexibility to a bot. The list of potential use cases is long! Traders can check for profits, automatically open positions, and more.

### Trade Ideas + Manual trading

You can always trade manually with Option Alpha. We LOVE automation, but also know you want to have the control to open (or close) your trades exactly when and how you want.

The best part is that when you open a position manually, you can still leverage powerful automated tools such as SmartPricing and Exit Options.

With Trade Ideas, you can remove the hard work of searching for trading opportunities. Trade Ideas automatically ranks millions of potential positions using multiple filters to sort trades by their ticker, expiration, directional bias, reward-to-risk, and probabilities. Once you find your trade, the position details are set for you automatically. You can always modify any of the settings before sending your order. It’s never been easier to find and place options trades!

<figure><img src="/files/ZdwwqGJMeFfvG86ufUxk" alt=""><figcaption></figcaption></figure>


# Creating a bot

Learn how to build and customize a new bot in Option Alpha.

To create a new bot, select “Create Bot" in the bot dashboard.

Customize the bot with a name and icon, select a brokerage or paper trading account, give the bot an allocation, and input position limits in the bot's global settings.

Global settings can be edited anytime but must be entered when a bot is created.

### Name <a href="#name" id="name"></a>

Give your bot a name. Naming the bot makes it easy to remember the bot’s purpose, inputs, and strategy. As you add more bots to your portfolio, it is important for the name to be easily identifiable to help keep you organized.

### Icon <a href="#icon" id="icon"></a>

You can customize your bot with a colored icon to help identify your strategies and organize your portfolio.

### Account <a href="#account" id="account"></a>

Link the bot to a connected brokerage account or paper trading account. You cannot change the bot's account after you create the bot (you'll need to [clone the bot](https://optionalpha.com/help/templates-and-cloning) to change accounts).

You do not need to have a connected brokerage account to use the Option Alpha paper trading account.

### Allocation <a href="#allocation" id="allocation"></a>

Allocation is the total capital available for the bot to open positions. The bot will not enter new positions if it exceeds the allocation limit. Bot allocation limits are calculated at position entry.

Allocation is different than risk or position limits. Allocation is the total purchasing power the bot has to open new positions. Risk defines the maximum amount that can be lost on a single position and can be set as a dollar or percentage amount in the automation editor.

Market conditions at position closing may cause increased capital allocations beyond the calculated maximum risk at position entry. If the market is illiquid or bid-ask spreads are wide, bots have the potential to risk more capital when the position is closed than was allocated at entry.

For example, if there is a wide bid-ask spread for a credit spread position, the ask price to close the spread may exceed the spread’s width. As always, you have the ability to [override positions](https://optionalpha.com/help/managing-positions), or [SmartPricing](https://optionalpha.com/help/smartpricing) settings, exit criteria, and orders at any time.

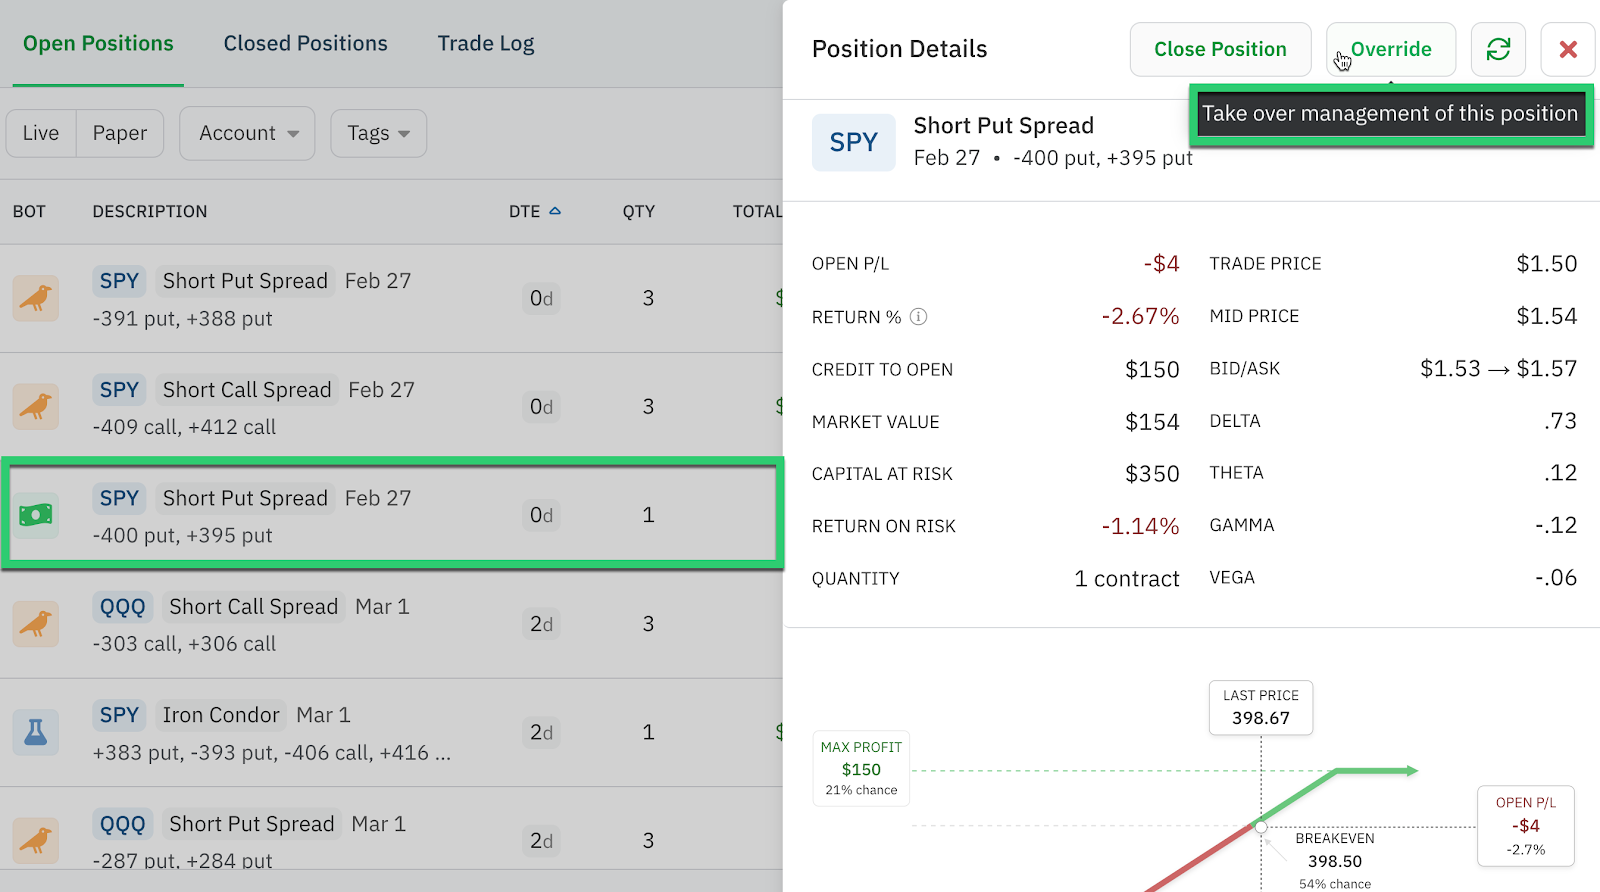
If you manually override a position, the Option Alpha platform no longer communicates with the position The position will not count against position limits or capital allocation limits. You may need to re-consider your bot’s capital allocation limit if you manually override positions.

### Position Limits - Daily <a href="#position-limits-daily" id="position-limits-daily"></a>

You must also set daily and total position limits when creating a bot. Bot scanners and other entry automations automatically turn off when a position limit is reached.

The daily limit is the maximum number of positions the bot can open in one day.

For example, a bot with a daily limit of three positions will stop scanning for new positions if three positions have been opened in one trading day.

Position limits are for opening positions only; you can close as many positions as you want.

### Position Limits - Total <a href="#position-limits-total" id="position-limits-total"></a>

The total limit is the maximum number of open positions available for a bot. The bot will not open new positions if the total position limit is reached.

For example, a bot with a total limit of six positions will stop scanning for new positions if there are six positions open inside the bot.

### Create Bot <a href="#create-bot" id="create-bot"></a>

Select “Create Bot” after you enter the global settings. You may edit the bot settings later if you want to make changes.

Your new bot is added to your portfolio. The Positions tab, Automations tab, and Bot Log are blank and ready for you to add automations. New bots are automatically "Off" by default when created. To turn on the bot, simply toggle the switch to "On" in the top right corner of the dashboard.

### Converting a paper bot to a live bot

A bot's account connection cannot be changed. To make a paper bot live, you'll need to [clone the bot](/tools/clone-bot-templates) and change the account type to connect it to a live brokerage account.

Click the ••• in the bot's top right corner and select 'Clone bot.'

<figure><img src="/files/dqrBrxPEIr8rg4YmU5Ps" alt=""><figcaption></figcaption></figure>

{% embed url="<https://youtu.be/BZYGVz6vJNE?si=awJzPcUDnrskXK_o>" %}

### Deleting a bot <a href="#deleting-a-bot" id="deleting-a-bot"></a>

To delete a bot, click on the three dots on the top right of the bot's dashboard and select 'Delete.' Deleting a bot will remove it from your account and all position stats will no longer be accessible. You can always save your bot as a template. There is no limit to the number of templates you can have.

### Using the Bot Wizard <a href="#using-the-bot-wizard" id="using-the-bot-wizard"></a>

Meet the bot wizard, our latest, groundbreaking technology to help you create bots. The bot wizard is the quickest and easiest way to build a bot and start your autotrading journey.

The bot wizard builds an entire bot automatically for you, using your entry and exit criteria for a particular strategy.

To build a new bot with the bot wizard, click the button at the top of your Bots homepage and select Bot Wizard.

Like creating any new bot, you’ll name the bot, choose an icon, select a paper trading or live account you’ve connected from our list of integrated brokers, and give the bot an allocation limit.

<figure><img src="/files/fdR17kzIffu9AGmIRdxE" alt=""><figcaption></figcaption></figure>

The bot wizard asks you to input position details such as trade frequency, ticker symbol, strategy type, days until expiration, strike prices, and contract/risk amount.

<figure><img src="/files/xLJAmmgJLEV4BrEYbdEx" alt=""><figcaption></figcaption></figure>

You can use any of the prefilled recipes we offer inside the platform, and this is a great way to introduce new traders to our easy-to-use, natural language logic. The wizard gives you a lot of flexibility to target specific position types.

Plus, you can always modify any of your bot’s settings after it is created.

Next, you’ll set up the strategy’s entry criteria using our extensive list of [decision recipes](https://optionalpha.com/help/decisions).

This is fun because you can use as many decision recipes as you want, and once you’re ready, the bot is created automatically for you inside your account.

For example, this bot will only open new positions in SPY if the price is above 500,The VIX rank is between 0-25, and the SPY RSI 14 Indicator is below 30.

<figure><img src="/files/70hWfNXDoCxsSNVZTHhJ" alt=""><figcaption></figcaption></figure>

You simply tell the bot wizard what you want the bot to filter before it opens new positions. You can make your automations as simple or complex as you like.

You also have complete control of the exit criteria to manage and close positions exactly how you want.

<figure><img src="/files/40BVCjJO3eTpUWgv62Nh" alt=""><figcaption></figcaption></figure>

For example, this bot will automatically exit a position if the short put spread has a 50% profit or the position expires in less than two days.

Once you’ve completed filling out the wizard and your new strategy is ready, simply click the button to create your bot. Your bot is automatically created on the back end using all the criteria and settings you put into the simple bot wizard. Yep, it’s that easy!

You can view your bot immediately and you see your automations. The entry scanner automation automates all criteria that would open a new position.

<figure><img src="/files/74P8WJWS5p4Cqndjiq56" alt=""><figcaption></figcaption></figure>

Remember, you can always modify and edit any of the automation’s fields inside the automation editor. Let’s say you want to change the IV rank to be above 75. Well, you simply make that change and then hit save, and you’re good to go with your new entry criteria. You can save all your changes, and the new entry criteria are reflected in the automation editor.

We created the bot wizard to streamline the process of creating your first bot and automating your favorite strategies.

Remember, you create the bot with your ideas and criteria; the bot wizard makes it simple with easy-to-use natural language recipes. You can always add, remove, or modify any settings before and after turning on the bot. You are in control!


# Connecting your brokerage account

Set up your Option Alpha account and connect one or more brokers to live trade with your bots.

{% embed url="<https://vimeo.com/1057857974>" %}

You can easily connect and manage your trading accounts inside the platform.

Go to [Settings --> Trading Accounts](https://app.optionalpha.com/settings/accounts) to connect your brokerage account and manage all account types, including any paper trading accounts.

<figure><img src="/files/IW893SbjuLlRUUcs2pMC" alt=""><figcaption></figcaption></figure>

To connect a brokerage account, select the "Authorize" button. This sends you to your broker's secure log-in page. Input your account information and select "Log in."

You will immediately be re-directed to the trading accounts page. All your connected and compatible accounts available for autotrading are displayed with their options approval levels.

You can always delete and remove connected accounts from the platform. You can also rename an account, which will only be visible within the Option Alpha platform.

You can connect your Option Alpha account to multiple brokerages, and each broker can have multiple connected accounts. However, you can only use one log-in per broker.

Once your brokerage account(s) are connected to the autotrading platform, you are ready to begin trading.


# Make your first trade

{% embed url="<https://vimeo.com/1056823482>" %}

While automation offers powerful tools for streamlining your trading strategies, many traders prefer to take a more hands-on approach. Option Alpha’s platform provides robust capabilities for manual trading, giving you the flexibility to open and close positions directly from various sections of the platform. Whether you prefer to trade manually or blend manual and automated strategies, the platform offers the tools you need to succeed.

### Flexibility in Manual Trading

One of the key advantages of manual trading on Option Alpha is the flexibility it offers. You can initiate manual trades from multiple areas within the platform, allowing you to choose the most convenient location for entering your trades. This adaptability means you can act quickly on market opportunities without being confined to a single method or section of the platform.

### The ‘New Position’ Window

At the heart of manual trading on Option Alpha is the universal **New Position** window. This window is designed to streamline the process of opening new positions, providing a consistent and user-friendly interface no matter where you access it from within the platform.

<figure><img src="https://cdn.prod.website-files.com/5fba23eb8789c3c7fcfb5f31/66c8b700472d2315dc9cd697_66c8b6e44cf3426c09e43284_new-position-window.png" alt=""><figcaption></figcaption></figure>

#### Key Features of the New Position Window

* **Symbol Selector**: Quickly choose the ticker symbol for the security you wish to trade.
* **Strategy Type Selector**: Select from a variety of trading strategies to tailor your position to your market outlook.
* **Expiration Selector**: Easily choose the expiration date for your options, helping you align your trade with your time horizon.
* **Access to Visual Charts**: The New Position window also provides access to several visual charts, offering deeper insights into market conditions:some text
  * **Main Pain Theory**: Analyze the potential pain point for options sellers.
  * **Open Interest**: View where traders are most heavily positioned in the options market.
  * **Daily Option Volume**: Track the daily trading volume for options.
  * **Implied Volatility Skew**: Examine the skew of implied volatility across different strikes.
  * **Historical vs. Implied Probability of Expiring ITM**: Compare historical probabilities with current implied probabilities to make informed decisions.
* **Quantity Control**: You have full control over the number of contracts or shares you wish to trade, allowing you to scale your position size according to your strategy.
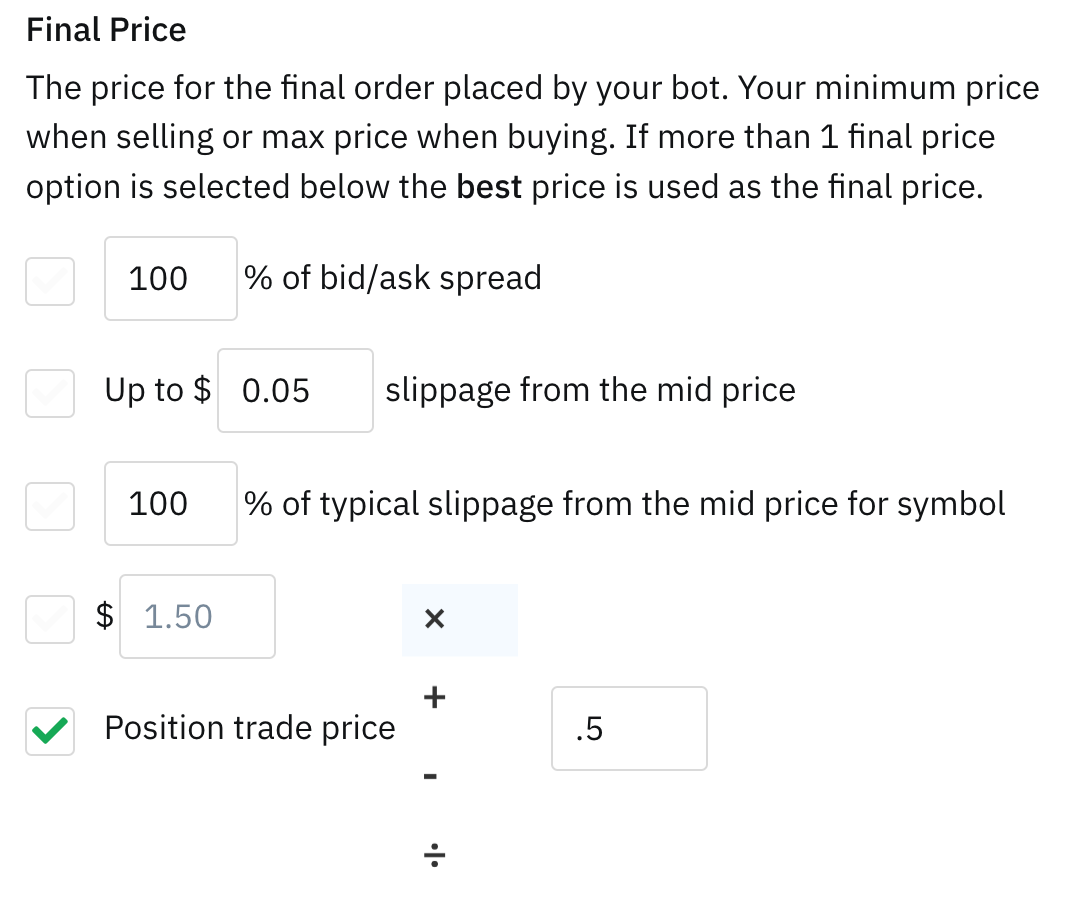
* **Final Price Setting**: The final price is the amount you are willing to accept when selling an option or the maximum you are willing to pay when buying. This price is determined by SmartPricing and defaults to 100% of the bid/ask spread if not specified. You can adjust this to suit your trading preferences, ensuring you’re comfortable with the terms of your order.
* **SmartPricing Preferences**: Option Alpha’s SmartPricing feature lets you choose the speed at which your order is executed. You can select from:some text
  * **Normal**: A balanced approach to pricing.
  * **Fast**: Prioritizes speed over price.
  * **Patient**: Focuses on getting the best price, even if it takes longer.
  * **Market Order**: Executes the order immediately at the current market price.
  * **Turn Off SmartPricing**: Submit a single limit price without SmartPricing’s intervention.
* **Bot Assignment**: Every manual position must be assigned to a bot. This is because a bot acts as the container or “home” for the position, providing the necessary services to monitor and manage it effectively. This requirement ensures that even manually entered positions benefit from the same robust management features as automated ones.
* **Exit Options**: The New Position window allows you to set exit options for your trade from the start. Once set, these options are assigned to the position for its entire lifecycle, reducing the need for further management and making the process more convenient.

Manual trading on Option Alpha is designed to give you full control over your trades while still benefiting from the platform’s powerful automation tools. The universal New Position window centralizes all the features you need to make informed decisions and manage your trades effectively. By combining manual trade entry with automated position management, you can create hybrid strategies that leverage the best of both worlds, allowing you to respond to market conditions with precision and confidence.


# Create custom watchlists

Filter and rank all available symbols using the Screener.

{% embed url="<https://vimeo.com/1052337984>" %}


# Bots

New to bots and autotrading? This is the best place to get started.

Together we'll walk through the basics of bots so you'll have the confidence to automate all your trading activities, saving you hours of time, adding control and precision to your strategies, and giving you the power to finally scale your portfolio.

Run fully automated strategies for options or stocks with no coding required. Stop trading your time and start optimizing your portfolio with bots.

### Create your bots

Start with pre-built bot templates you can customize or build your own custom bots from scratch.

### Add automations

Automations tell the bot when to take action, what to look for, when to open positions, when to exit positions, and much more.

### Customize your decisions

Add actions and decisions using natural language recipes to the automation editor making it easy and fun to build your strategies.

### Leverage SmartPricing

Our proprietary technology uses timed intervals and adjusts pricing dynamically to optimize entries and exits.

### Monitor bot activity

You’ll always have complete visibility and absolute control over everything happening inside your bot at all times.

### Scale your portfolio

Run multiple systems and strategies all at the same time without the headache of watching every market tick by tick.<br>

<br>


# Safeguards

Bots have safeguards to protect traders. You are always in control of your bot's allocation and position limits. Here is everything you need to know when setting your safeguards and limits.

{% embed url="<https://vimeo.com/1052337172>" %}

The Option Alpha autotrading platform has been designed with multiple safeguards and limits to protect traders. Bots necessitate you to think through the entire trading process from entry to exit. This is for your safety.

Bot safeguards are designed to help traders think about their automations critically. Bots require that you define what to do, when to do it, and with how much capital to allocate. Automations only run when they are turned on. Position and allocation limits help manage overall portfolio exposure, and [automations automatically turn off](/technical-documentation/troubleshooting/excessive-errors-failsafe) if a limit triggers. The bot will alert you if an automation is missing an input so that you do not create an automation without clearly defining the actions the bot should perform.

You can always paper trade with any bot and [test automations](/technical-documentation/troubleshooting/testing-automations) in live market conditions.

### Bot safeguards <a href="#bot-safeguards" id="bot-safeguards"></a>

Bot safeguards are in the bot's Settings. Safeguards define the bot's allocation and position limits. You can edit the safeguards at any time.

<figure><img src="/files/MD24Pd0UJzbXUq0NnOol" alt=""><figcaption></figcaption></figure>

### Allocation safeguards <a href="#allocation-safeguards" id="allocation-safeguards"></a>

When you create a new bot, you must manually input an allocation limit.

<figure><img src="/files/U0pcFGeEEhfnnSShqude" alt=""><figcaption></figcaption></figure>

Allocation is the total capital from your trading account that is available for a bot to open positions. Bot allocation limits are calculated at position entry.

The bot will not open a new position once the allocation limit is reached. If the allocation limit is reached, a new position will only open once another position has been closed and additional capital becomes available, or you change the bot's settings.

Market conditions at position closing may cause increased capital allocations beyond the calculated maximum risk at position entry. If the market is illiquid or bid-ask spreads are wide, bots have the potential to risk more capital when the position is closed than was allocated at entry.

For example, if there is a wide bid-ask spread for a credit spread position, the ask price to close the spread may exceed the spread’s width. As always, you have the ability to manually override positions, [SmartPricing](/tools/bots/smartpricing) settings, exit criteria, and orders at any time.

If you manually override a position, the Option Alpha platform no longer communicates with the position, and the position will not count against position limits or capital allocation limits. You will need to manage the position manually. You may also need to re-consider your bot’s capital allocation limit if you manually override positions.

### Position safeguards <a href="#position-safeguards" id="position-safeguards"></a>

You can manually select and modify daily and total position in the bot's safeguards. Bots allow for ten daily positions and ten total open positions.

'Daily positions limits' is the maximum number of positions a bot can open in one trading day.

'Position limits' is the maximum number of positions that can be open in a bot at any time.

Position limits are for opening positions only; there is no limit on the amount of closing positions, and closed positions do not impact the safeguard position limits.

Scanners are automatically turned off if a bot reaches either limit. If a bot has reached an allocation or position limit, the scanner turns off and a warning is displayed in the Position statement and Bot Log stating that a position limit has been reached.

### Trade safeguards <a href="#trade-safeguards" id="trade-safeguards"></a>

Trade safeguards require you to manually input certain values, such as the ticker symbol, expiration date, strike price, and more. You must also quantify maximum risk, contract amount, or a percentage of the bot's allocation.

These protections are in place because you are responsible for telling the bot exactly what to do.

### Other safeguards <a href="#other-safeguards" id="other-safeguards"></a>

Bots may open risk-defined options positions. This feature is in place to protect traders from undefined risk and to control margin requirements.

Synthetic naked positions can be replicated by purchasing far out-of-the-money long options to create a wide credit spread.


# Automations

Automations contain step-by-step actions performed by your bot on a schedule. Learn how to create and schedule automations for options trading.

Most traders are used to doing everything manually when it comes to options trading: hunting for new ideas, analyzing potential trades, and watching positions. But with automations, you can finally leverage technology to improve your trading and free up your valuable time. Let's help you understand the basics of automations and how to use them for trading.

### What are automations? <a href="#what-are-automations" id="what-are-automations"></a>

Automations are simply a set of instructions you give the bot to perform. The automation tells the bot exactly what to look for, what decisions to make, and what actions to take if necessary. Plus, each automation you build is completely flexible, so you can put actions and decisions in whatever sequence or order you want the bot to go through when the automation runs. It's an entirely new way of trading focused on helping you become a more disciplined and systematic trader.

{% hint style="info" %}
Visit our [Fast Track Videos](https://optionalpha.com/fast-track#automation) to learn more about automations.
{% endhint %}

### What can automations do for me? <a href="#what-can-automations-do-for-me" id="what-can-automations-do-for-me"></a>

Automations can evaluate market data, check potential trading opportunities, make complex trading decisions, open positions, close positions, send notifications, and so much more. Here are just a few examples of what you could have an automation do for you:

1. Watch SPY for a 1% drop intraday and open a new short put spread position, then close that position when it reaches a 25% profit.
2. Scan a list of symbols for high implied volatility and open new iron condor positions on those symbols.
3. Wait until 1 pm, then check a list of symbols to see if any symbols have a technical buy/sell signal and open one new position in each symbol.
4. Monitor any option position for profit targets, stop-losses, or nearing expiration all at once and trigger an automated closing order if any exit criteria are met.
5. Close any position that is less than 3 days from expiration only if it's ITM and profitable by at least $100.

<figure><img src="/files/WXnPF1GWaFBOWbwizvs2" alt=""><figcaption></figcaption></figure>

Is this all you can do with automations? No way; this is just the tip of the iceberg. Remember, automations are just a set of instructions (steps/actions/decisions) for the bot to perform when the automation runs. They can be as simple or complex as you want.

#### 1. Create automation <a href="#id-1.-create-automation" id="id-1.-create-automation"></a>

Creating a new automation is as simple as telling the bot what to do when the automation runs. Inside the automation editor, you'll add steps to your automation in the order and sequence you'd like them performed by the bot. The steps you can add to an automation are broadly categorized as either:

* Actions: These tell the bot to perform a specific action, such as making a decision, opening/closing a position, sending a notification, and/or tagging.
* Loops: These repeat the same subsequent actions for each [symbol](https://optionalpha.com/help/loops) in a list of symbols or each [position](https://optionalpha.com/help/loops) currently open in a bot.

With the flexibility and control to build automations using actions and loops, you can run virtually any automated (or semi-automated) trading strategy you want, from the most simple trend trading strategy to a highly sophisticated self-hedging, volatility adjusting strategy.

#### 2. Schedule automation <a href="#id-2.-schedule-automation" id="id-2.-schedule-automation"></a>

Once you've created your automation, you'll need to schedule the automation to tell the bot when you want the automation to run. There are three main ways you can schedule an automation:

* **Continuous**: as either *Scanners*, which run every 15 minutes by default to find and enter new positions only if the bot is under its position limits, or *Monitors*, which run every 15 mins by default only if the bot has an option position to monitor and helps close positions when your criteria are met. You can also self-select 5-minute and 1-minute scans. Scan speeds are set at the bot-level; each bot defaults to 15 minutes unless you select a different speed.**‍**
* **Triggers**: run an automation on a specific *Date*, on a *Recurring Schedule*, when the *Market Opens/Closes*, or when a *Position is Opened/Closed*. These triggers run the automation one time when each event occurs.**‍**
* **Manual**: with custom *Buttons* that are added to your bot dashboard so you can run any automation instantly with the click of a button.

Automations are 'OFF' by default. Turn automations 'ON' and they will run at the scheduled intervals.

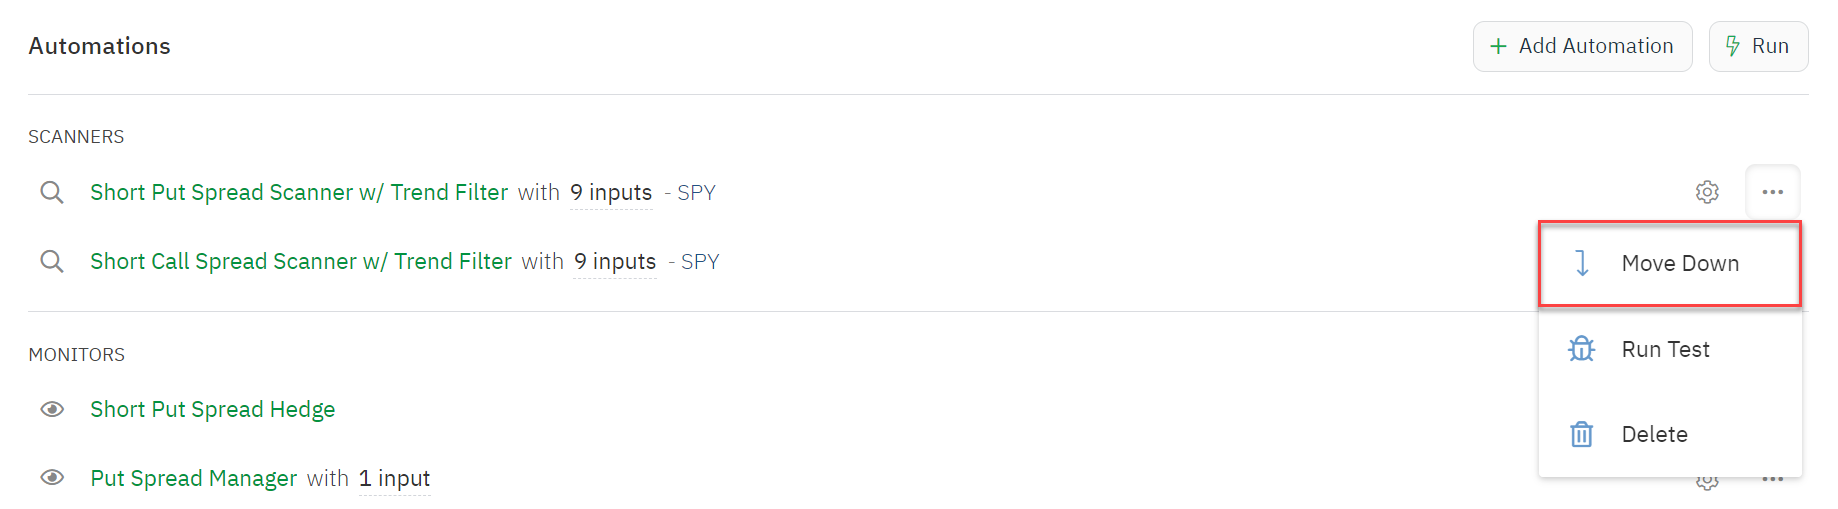
The schedule tells the bot how often or under what conditions the automation can run. You can edit/adjust the schedule at any time using the gear icon in the bot's Settings tab, and even order automations to run before other automations if you have multiple types running inside your bot.

<figure><img src="/files/tVvP37LLnCw9z9gMDH9L" alt=""><figcaption></figcaption></figure>

### **Scan Speed**

Your bot's Scan Speed setting determines how frequently scanner and monitor automations run when the market is open.

Your bot's default scan speed is set to 15 minutes. That means your bot will automatically run scanner and monitor automations every 15 minutes between 9:45 am and 3:45 pm EST. You can also self-select 5-minute and 1-minute scans. Scan speeds are set at the bot-level; each bot defaults to 15 minutes unless you select a different speed.

In your settings, you can customize when automations run, from as early as 9:31 am EST until 5 minutes before the market close.

<figure><img src="https://cdn.prod.website-files.com/5fba23eb8789c3c7fcfb5f31/6740d997069616137e3e9790_6740d90ef595ca2f2e25c3a9_Customizable%2520schedule%2520for%2520automations%2520and%2520exit%2520options.png" alt=""><figcaption></figcaption></figure>

> 1 minute scans run every 1 minute unless the previous 1 minute interval has not completed all scheduled automations. If the previous interval is still running the bot will try again at the next 1 minute interval.

#### Triggers

Triggers allow you to set an automation to run based on specific actions:

* **Date** - At a specific date and time
* **Repeating** - On a recurring schedule
* **Market open** - 10 minutes after the market opens (9:40 am EST)
* **Market close** - 10 minutes before the market closes (3:50 pm EST)
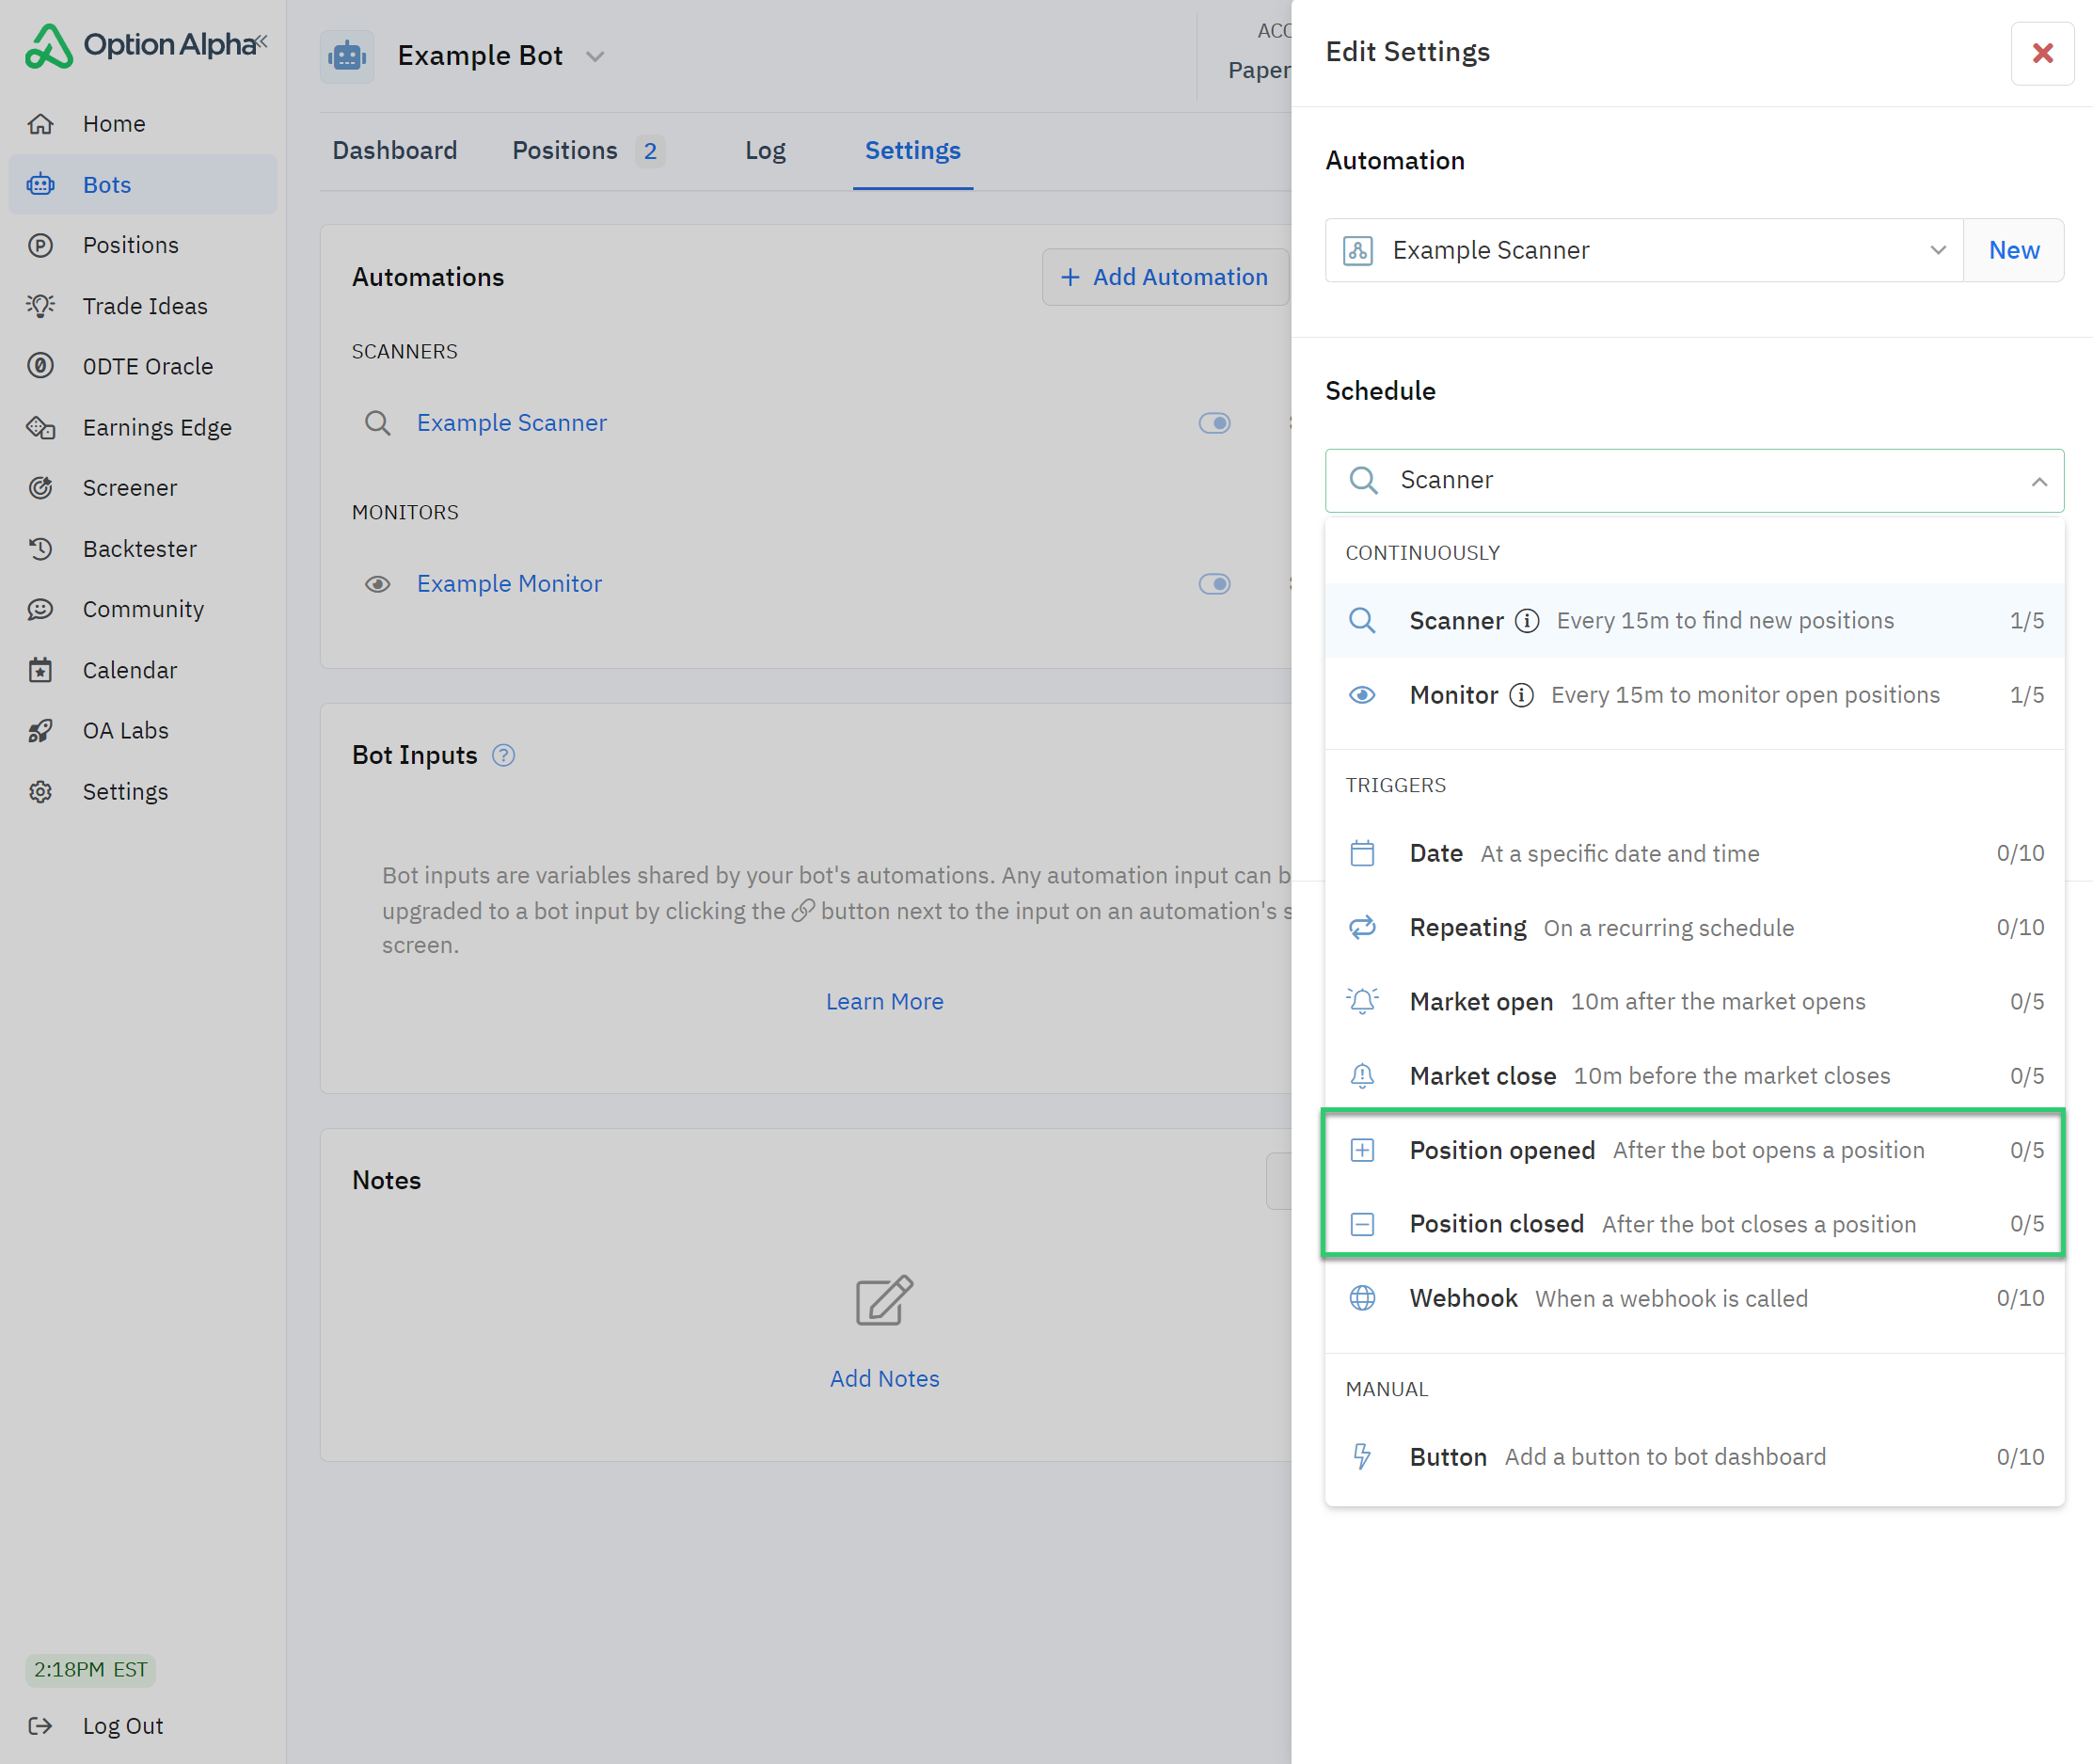
* **Position opened** - After the bot opens a position
* **Position closed** - After the bot closes a position
* **Webhook** - When a webhook is called (learn more: [Option Alpha Webhooks](https://optionalpha.com/blog/webhooks))

Market open automations run first at the time you specify automations to begin. Scanner automations will begin running after the market open automation. Market close automations run last after the final scan of the day.

#### Manual

Create a button to run an automation instantly whenever you click the button.

* **Button** - Add abutton to the bot's dashboard

{% embed url="<https://vimeo.com/1052338835>" %}

### Save, Reuse & Copy Automations <a href="#save-reuse-and-copy-automations" id="save-reuse-and-copy-automations"></a>

You can save automations to your library and create multiple folders to organize them all. Automations can also be shared across multiple bots. Any changes made to an automation will flow through anywhere the automation is used, including other bots. You can copy an automation and make changes to the new version without impacting the original.


# Loops

With loops, you can scan a custom watchlist of tickers or manage multiple positions in a single automation.

## Using Loops

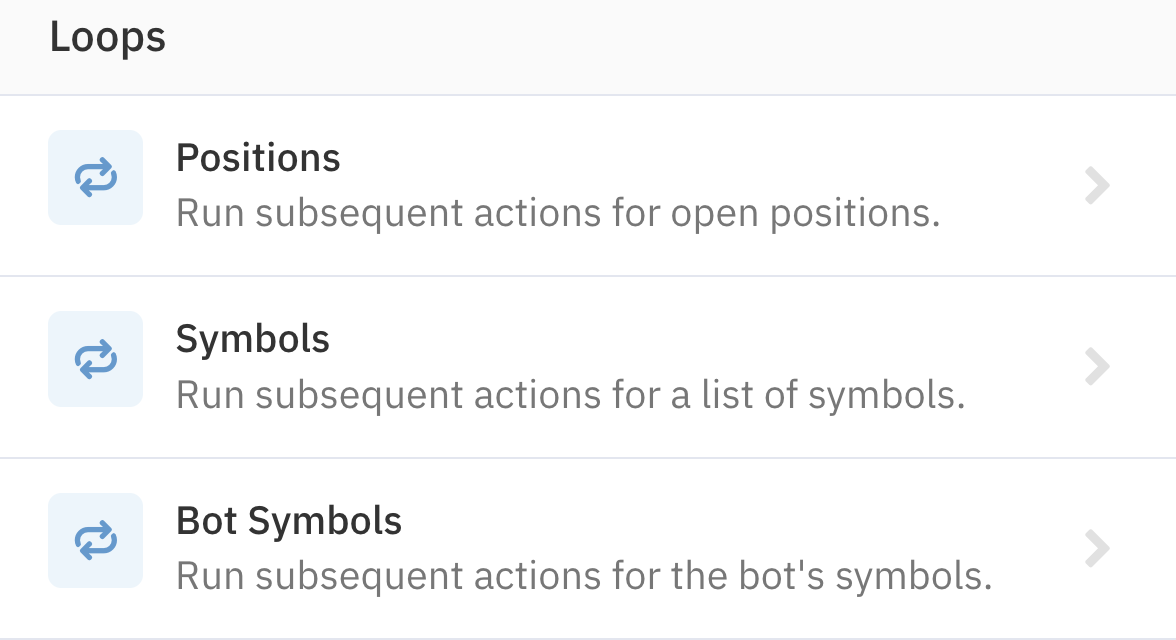
Loops allow us to run actions for multiple positions and symbols. Loops are typically added to the beginning of an automation so that all subsequent actions are connected to the loop.

There are three types of Loops available in automations:

* Position Loops
* Symbol Loops
* Bot Symbol Loops

<figure><img src="https://2799944806-files.gitbook.io/~/files/v0/b/gitbook-x-prod.appspot.com/o/spaces%2F-MYjluAVRcRcfh1YL43z%2Fuploads%2FBpvP9dKvr7EGfhlCQCyC%2Fimage.png?alt=media&#x26;token=75503e11-6beb-4a9c-b9f6-b9a456438afb" alt=""><figcaption></figcaption></figure>

### Position Loops

To manage all open positions (or a specific position type) inside a bot, we can use a "Position Loop."

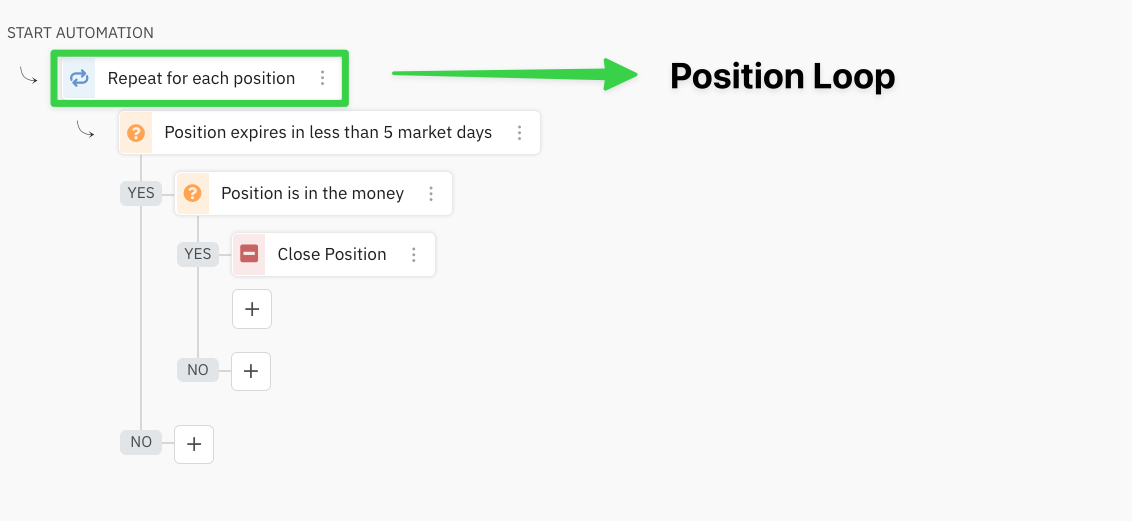
A "Position Loop" repeats the action(s) below it for each position the bot has open, enabling us to apply one or more management techniques across one or more positions inside an automation.

**Example:** Use a "Position Loop" to monitor all open trades and close any position that is in-the-money less than 5 days from expiration:

<figure><img src="https://2799944806-files.gitbook.io/~/files/v0/b/gitbook-x-prod.appspot.com/o/spaces%2F-MYjluAVRcRcfh1YL43z%2Fuploads%2Fnz9wLL48CrSDUJdSychE%2FCleanShot%202025-10-30%20at%2014.02.02.png?alt=media&#x26;token=df32fab5-916b-47c5-968f-34b186948039" alt=""><figcaption></figcaption></figure>

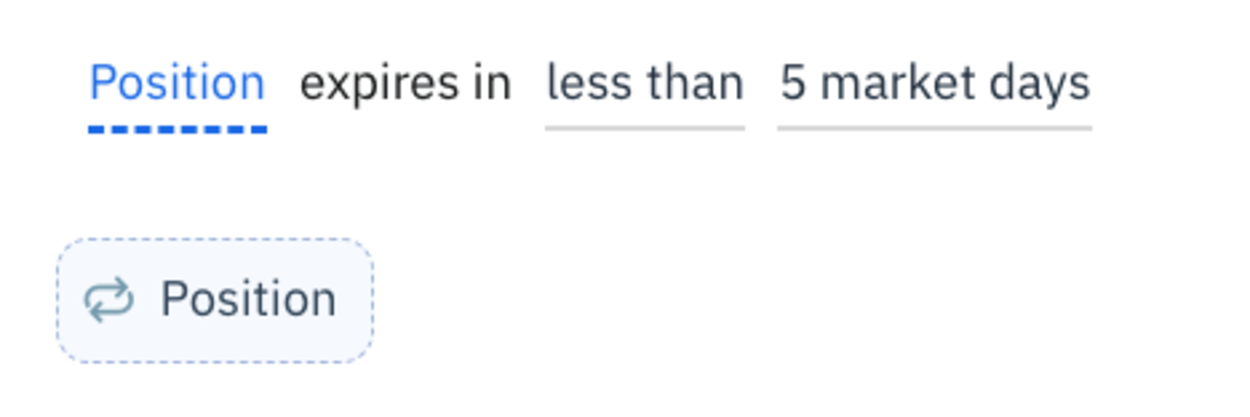
All "Position" inputs below the loop action will automatically be linked to the current position in the loop:

<figure><img src="https://2799944806-files.gitbook.io/~/files/v0/b/gitbook-x-prod.appspot.com/o/spaces%2F-MYjluAVRcRcfh1YL43z%2Fuploads%2FOcrEqUELr7HUEQ6EXzLg%2Fimage.png?alt=media&#x26;token=c7c6c159-da8d-4033-bc43-ea1b62f62981" alt=""><figcaption></figcaption></figure>

This video shows how to set up a monitor automation using a Position Loop:

### Symbol Loops

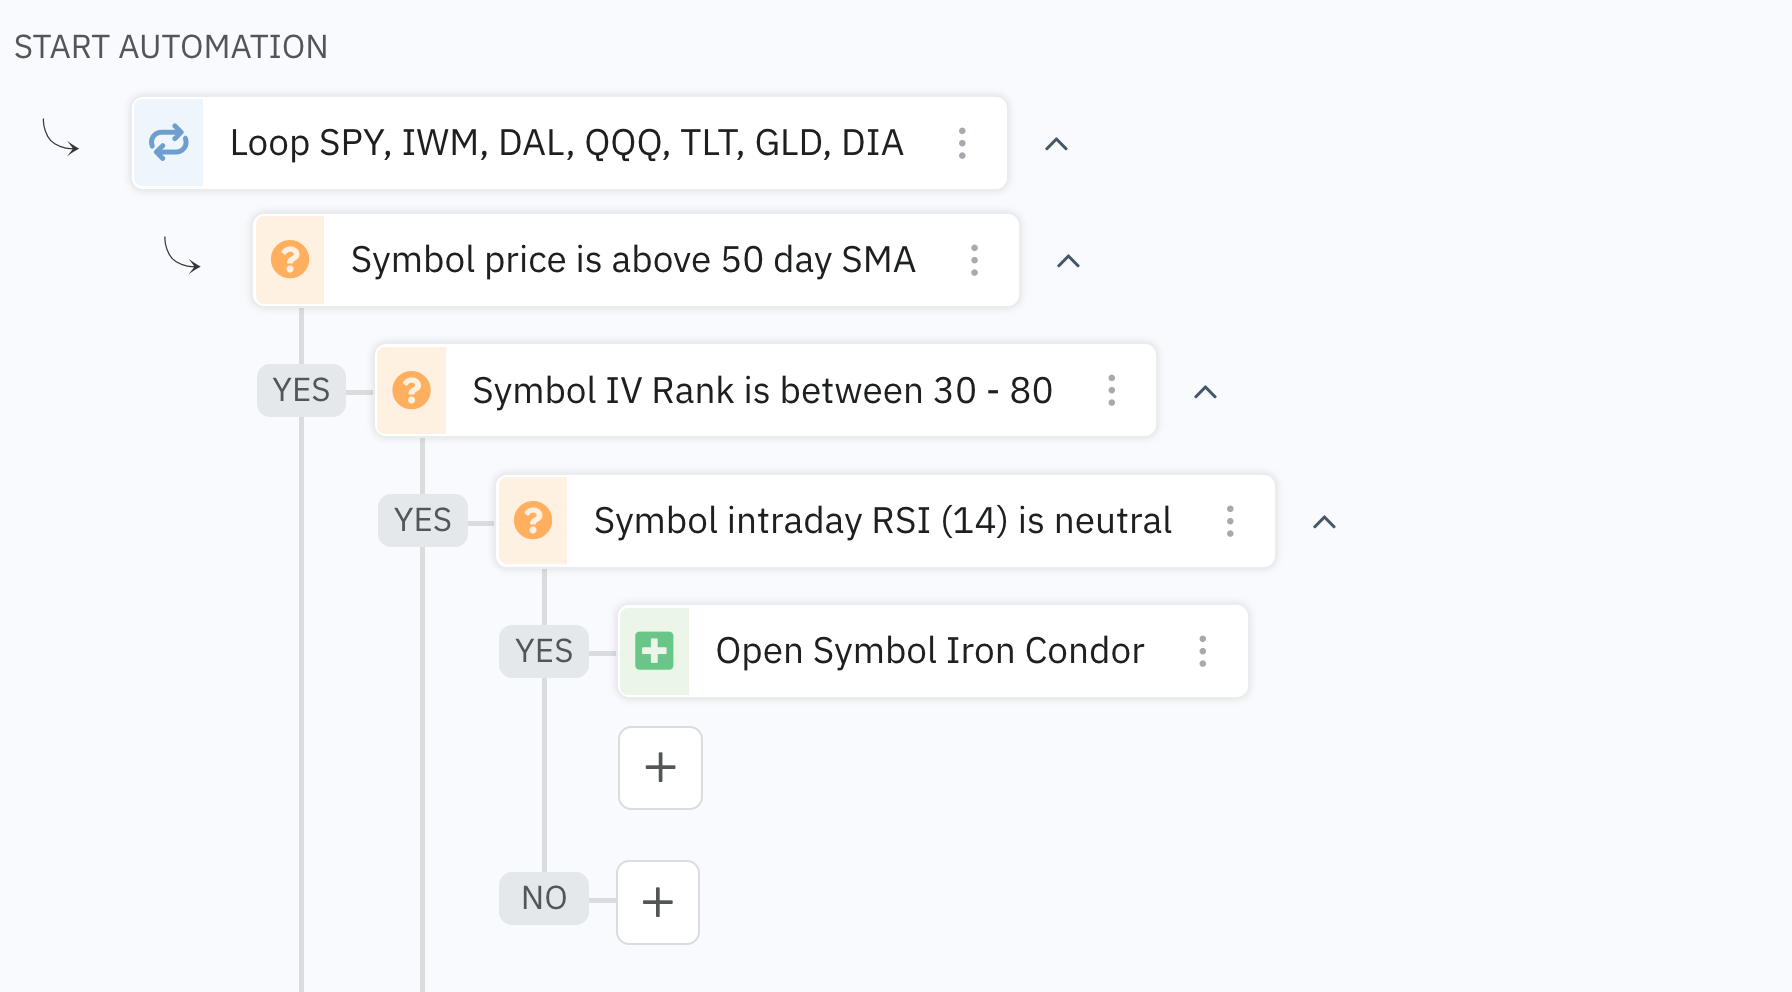
Symbol loops run all subsequent actions after the loop for the selected ticker symbols. This enables us to evaluate multiple criteria for different symbols, and only symbols that meet the criteria will proceed down the automation's 'Yes' path.

**Example:** Use a "Symbol Loop" to scan multiple tickers and open an iron condor if the symbol passes the following criteria:

* Above the 50-day SMA
* Has an IV Rank between 30-80
* RSI is neutral (between 30-70)

<figure><img src="https://2799944806-files.gitbook.io/~/files/v0/b/gitbook-x-prod.appspot.com/o/spaces%2F-MYjluAVRcRcfh1YL43z%2Fuploads%2FLbCgcS4s4To0crg7Qujr%2Fimage.png?alt=media&#x26;token=8361997c-2141-4c50-8442-0f0c04dcde1f" alt=""><figcaption></figcaption></figure>

This video shows how to set up a scanner automation using a Symbol Loop:

### Bot Symbol Loops

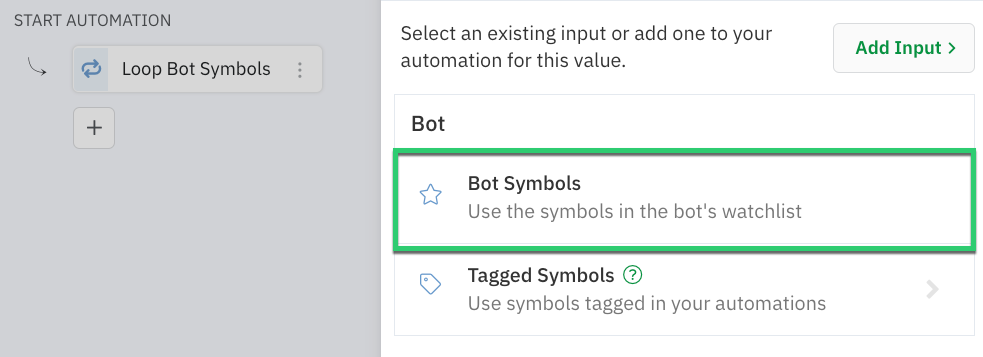
Similar to Symbol loops, Bot Symbol loops will loop through multiple symbols and run all subsequent actions. [Bot Symbols use our custom watchlists](https://optionalpha.com/blog/bot-symbols-and-custom-shareable-watchlists) to sort and filter ticker symbols dynamically in real-time.

<figure><img src="https://2799944806-files.gitbook.io/~/files/v0/b/gitbook-x-prod.appspot.com/o/spaces%2F-MYjluAVRcRcfh1YL43z%2Fuploads%2FAD4Jkiu4At0ypH1bk6kO%2Fimage.png?alt=media&#x26;token=e412d450-9da0-485c-b902-853c4cd79fd7" alt=""><figcaption></figcaption></figure>

This video shows how to use Bot Symbols inside an automation:

#### Loop Inputs

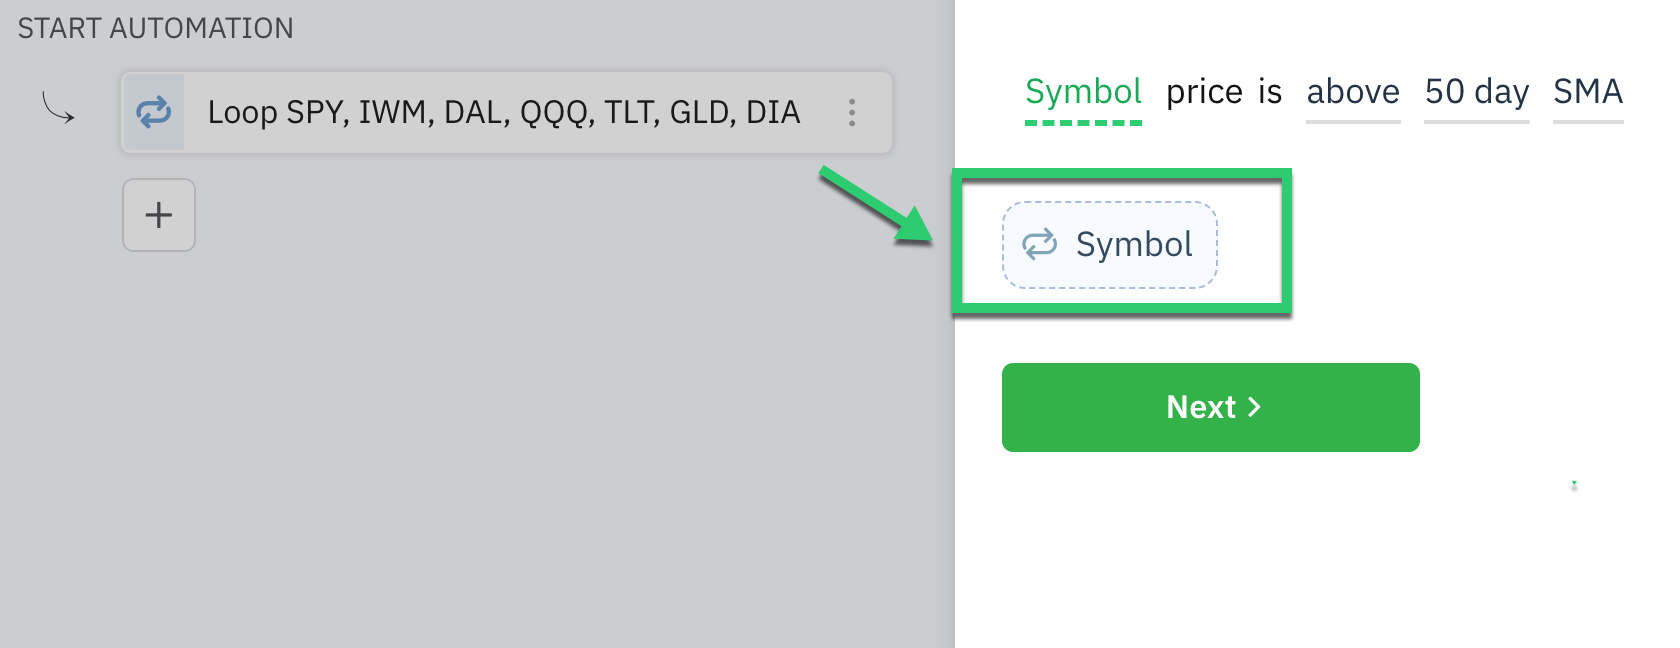
When using any loop, the automation will automatically link to the symbol or position input variable inside a decision as an input.

For example, if using a Symbol loop for multiple tickers, the decision will auto-populate the Symbol loop into the the decision's symbol field.

<figure><img src="https://2799944806-files.gitbook.io/~/files/v0/b/gitbook-x-prod.appspot.com/o/spaces%2F-MYjluAVRcRcfh1YL43z%2Fuploads%2Fcz3xQ6qImrpgPswBVhVi%2Fimage.png?alt=media&#x26;token=5505b562-702c-41b5-a8e9-5b531376b72d" alt=""><figcaption></figcaption></figure>

With "Position Loops," all "Position" inputs below the loop action will automatically be linked to the current position in the loop:

<figure><img src="https://2799944806-files.gitbook.io/~/files/v0/b/gitbook-x-prod.appspot.com/o/spaces%2F-MYjluAVRcRcfh1YL43z%2Fuploads%2FOcrEqUELr7HUEQ6EXzLg%2Fimage.png?alt=media&#x26;token=c7c6c159-da8d-4033-bc43-ea1b62f62981" alt=""><figcaption></figcaption></figure>

Do not establish an input for the "symbol" or "position." Always use the the supplied input that appears when adding an action.


# Decision actions

Decision actions allow bots to conditionally follow yes/no paths inside an automation. Learn how decision recipes reference different market, positions, and opportunity criteria.

## Decisions

Decision recipes are the core components of creating sophisticated trading automations. These pre-built logic blocks handle a wide range of conditions, from simple price movements to complex market indicators and trade performance metrics. By understanding and effectively combining these recipes, you can construct automations that align precisely with your trading strategy.

#### Types of Decision Recipes

* Symbol-Based Decisions: These recipes focus on the characteristics of a specific symbol. You can evaluate its price, volatility, or other properties specific to the symbol referenced.
* Indicator-Based Decisions: Based on technical indicators, these recipes allow you to assess market trends and conditions. You can set conditions on daily closing values of indicators for the assigned symbol.
* Position-Based Decisions: Evaluate the performance of an open position using various metrics and statistics. These decisions are crucial for managing risk and optimizing profits.
* Bot-Based Decisions: Analyze the behavior and performance of your bot itself. You can check specific bot properties and metrics to make adjustments to your strategy.
* Opportunity-Based Decisions: Focus on the characteristics of a potential trade opportunity before it's opened. You can filter opportunities based on specific criteria.
* General Decisions: These versatile recipes cover broader conditions like time of day, day of week, and economic news events.

### Conditional Actions

Conditional actions function similarly to decision actions. However, instead of following a "Yes" or "No" branch, it allows you to evaluate a subset of criteria by doing the actions on the "Yes" path if the conditional is true.&#x20;

If the answer is "Yes" it continues down the conditional path, following "Yes" logic before returning to the original automation flow. If the answer to the condition is "No," the automation simply continues to the next action.

For example, in the image below, the conditional action asks if the VIX is below 40. If 'Yes," the bot loops through its bot symbols and checks if the included tickers are above their 50-day SMA. If they are, the symbol is tagged 'uptrend;' if not, the symbol is not tagged. The decisions nested under the conditional end and the bot continues back down the original automation path, opening a short put spread on symbols with the tag.

[This blog and video](https://optionalpha.com/blog/use-tagged-symbols-to-find-trade-ideas) provide a guided step-by-step breakdown of using the Conditional action in this example.

<figure><img src="/files/IixeSN5LHRFOxaui3DZO" alt=""><figcaption></figcaption></figure>

#### Building Your Automation Logic

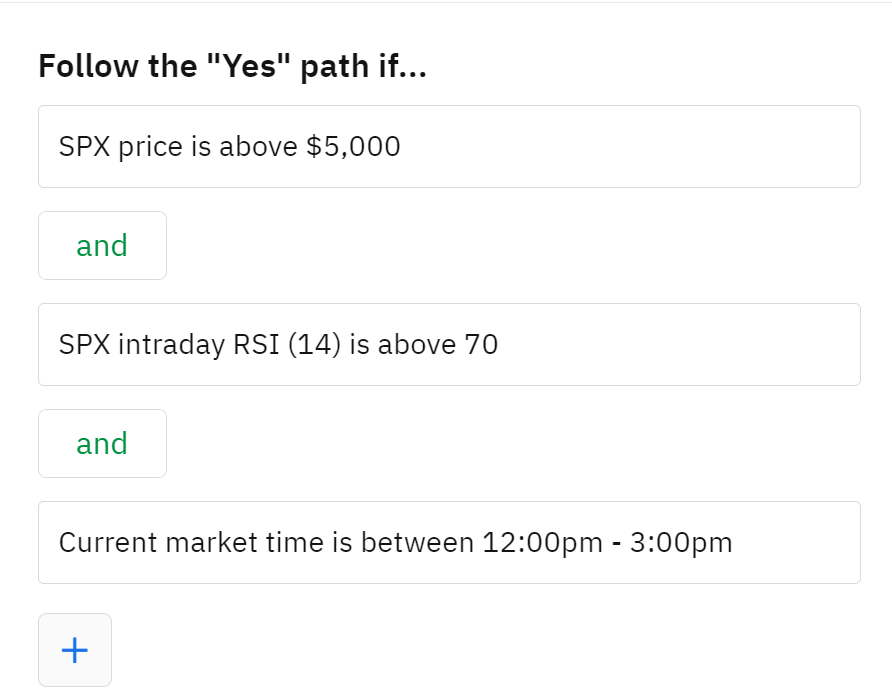
Decision recipes are the building blocks for your automation's logic flow. By connecting these recipes in various combinations, you can create complex conditions that trigger different actions. For example, you might combine a symbol-based decision (price above a certain level), an indicator-based decision (RSI overbought), and a time-based decision (specific trading hours) to open a short position.<br>

<figure><img src="https://2799944806-files.gitbook.io/~/files/v0/b/gitbook-x-prod.appspot.com/o/spaces%2F-MYjluAVRcRcfh1YL43z%2Fuploads%2FggnB6bfFOQH3MvC4XLEw%2Fimage.png?alt=media&#x26;token=d29154d3-d04c-453d-ae65-ebe94719efc1" alt=""><figcaption></figcaption></figure>

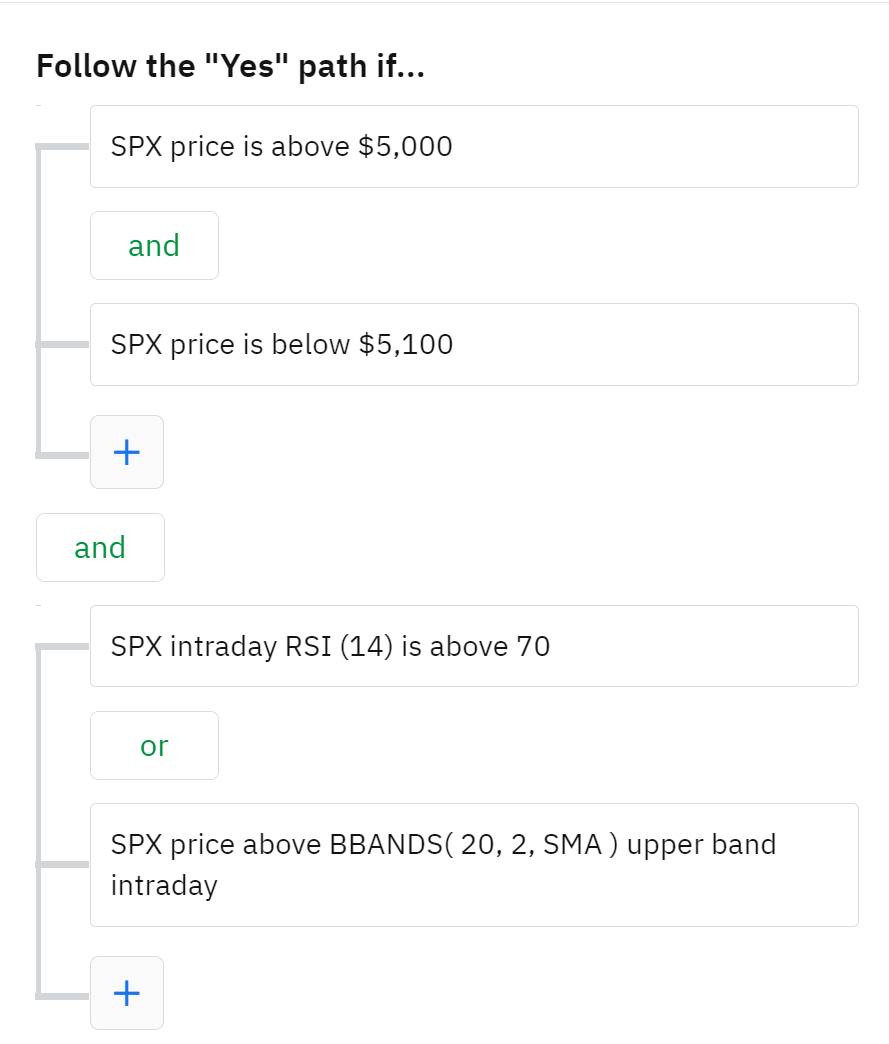
Additionally, you can group decisions together using Or and And conditions which enhances the logic being checked even further. For example, you may want to check for a situation where one, or the other, conditions could be true for a trade to be attempted. Lets build off the previous example; in this case we'll use an Or condition to build a decision that is checking if the RSI is overbought above 70 or that the price is above Bollinger Band High Band Level.<br>

<figure><img src="https://2799944806-files.gitbook.io/~/files/v0/b/gitbook-x-prod.appspot.com/o/spaces%2F-MYjluAVRcRcfh1YL43z%2Fuploads%2F7aPMCPhYLyTrPtm7LTcc%2Fimage.png?alt=media&#x26;token=593588ee-b8ea-4de1-b280-d413f55b5df1" alt=""><figcaption></figcaption></figure>

#### Leveraging the Editor for Efficiency

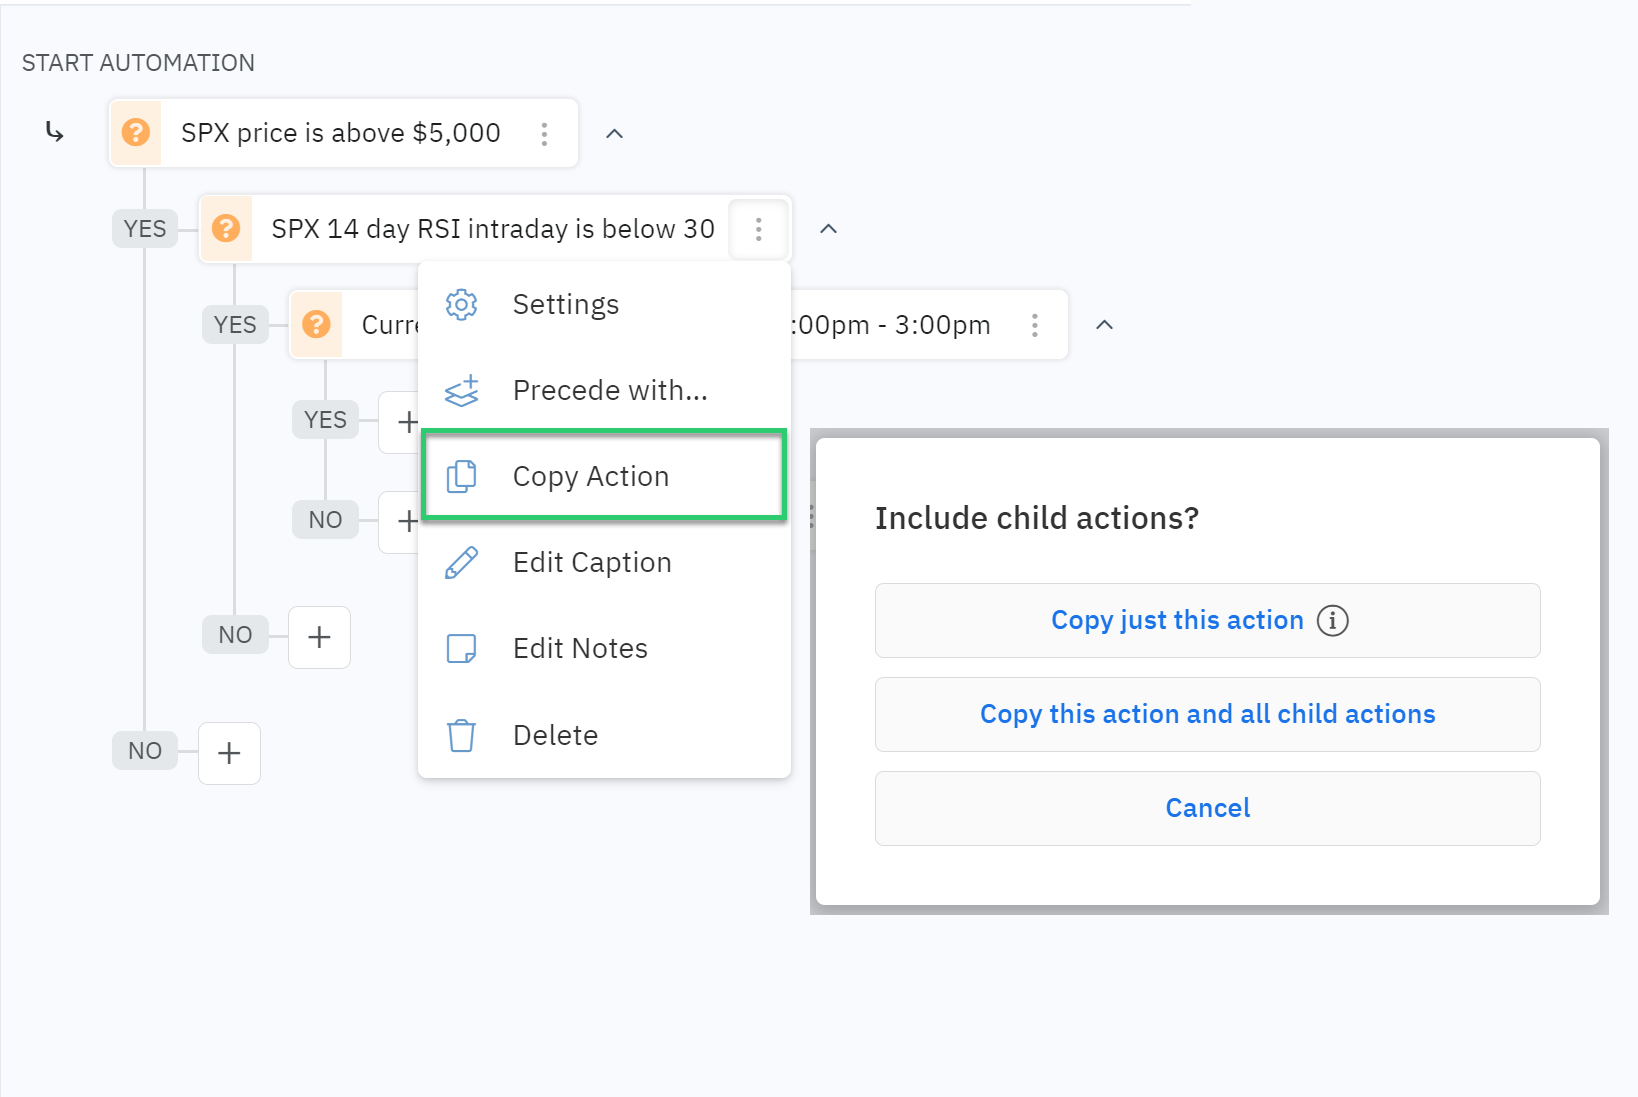
Option Alpha's editor is designed to streamline the automation building process. One of its powerful new features is the ability to copy and paste groups of decisions. This allows you to reuse complex logic structures across multiple automations, saving you time and effort.

<figure><img src="https://2799944806-files.gitbook.io/~/files/v0/b/gitbook-x-prod.appspot.com/o/spaces%2F-MYjluAVRcRcfh1YL43z%2Fuploads%2FYmbjA9ijWbpYTDl2e7Dm%2Fimage.png?alt=media&#x26;token=504cac87-65a6-4b64-b1ec-bdc1e96333c4" alt=""><figcaption></figcaption></figure>

By mastering the art of combining decision recipes, you can create highly customized and effective trading automations. Experiment with different combinations to find the strategies that best suit your trading style.


# Inputs

Inputs are dynamic tools that give you added flexibility with variables. Discover the many ways you can leverage the power of inputs in your bots and automations.

## Using Inputs

Efficiency is one of the key advantages of using automation in trading. With less manual trading, you have more time to discover, refine, and scale your strategies. One of the most powerful tools for increasing bot functionality on Option Alpha’s platform is the use of custom inputs. This guide will help you understand how to use inputs effectively, the hierarchy involved, and the best practices for managing these inputs.

<figure><img src="https://2799944806-files.gitbook.io/~/files/v0/b/gitbook-x-prod.appspot.com/o/spaces%2F-MYjluAVRcRcfh1YL43z%2Fuploads%2FzPZLEEcrIMfxKKLkkTPl%2Fimage.png?alt=media&#x26;token=9f3a6b20-0550-42e9-9c42-b35427be9bda" alt=""><figcaption></figcaption></figure>

#### What Are Inputs?

Custom inputs are variable fields within your automations that you can link and edit in the future. They provide a convenient way to manage and update key values without having to edit each individual instance within an automation. By using inputs, you can change a value in one place, and that change will automatically apply wherever the input is referenced in the automation.

For example, if you create a custom input for a ticker symbol within an automation, you can reference that input throughout the automation. Then, if you need to change the ticker symbol later, you simply update the custom input, and the change is reflected everywhere that input is used.

#### Input Hierarchy: Automation-Level vs. Bot-Level Inputs

One of the most important concepts to understand is the hierarchy of inputs. In Option Alpha, you can manage inputs at two levels:

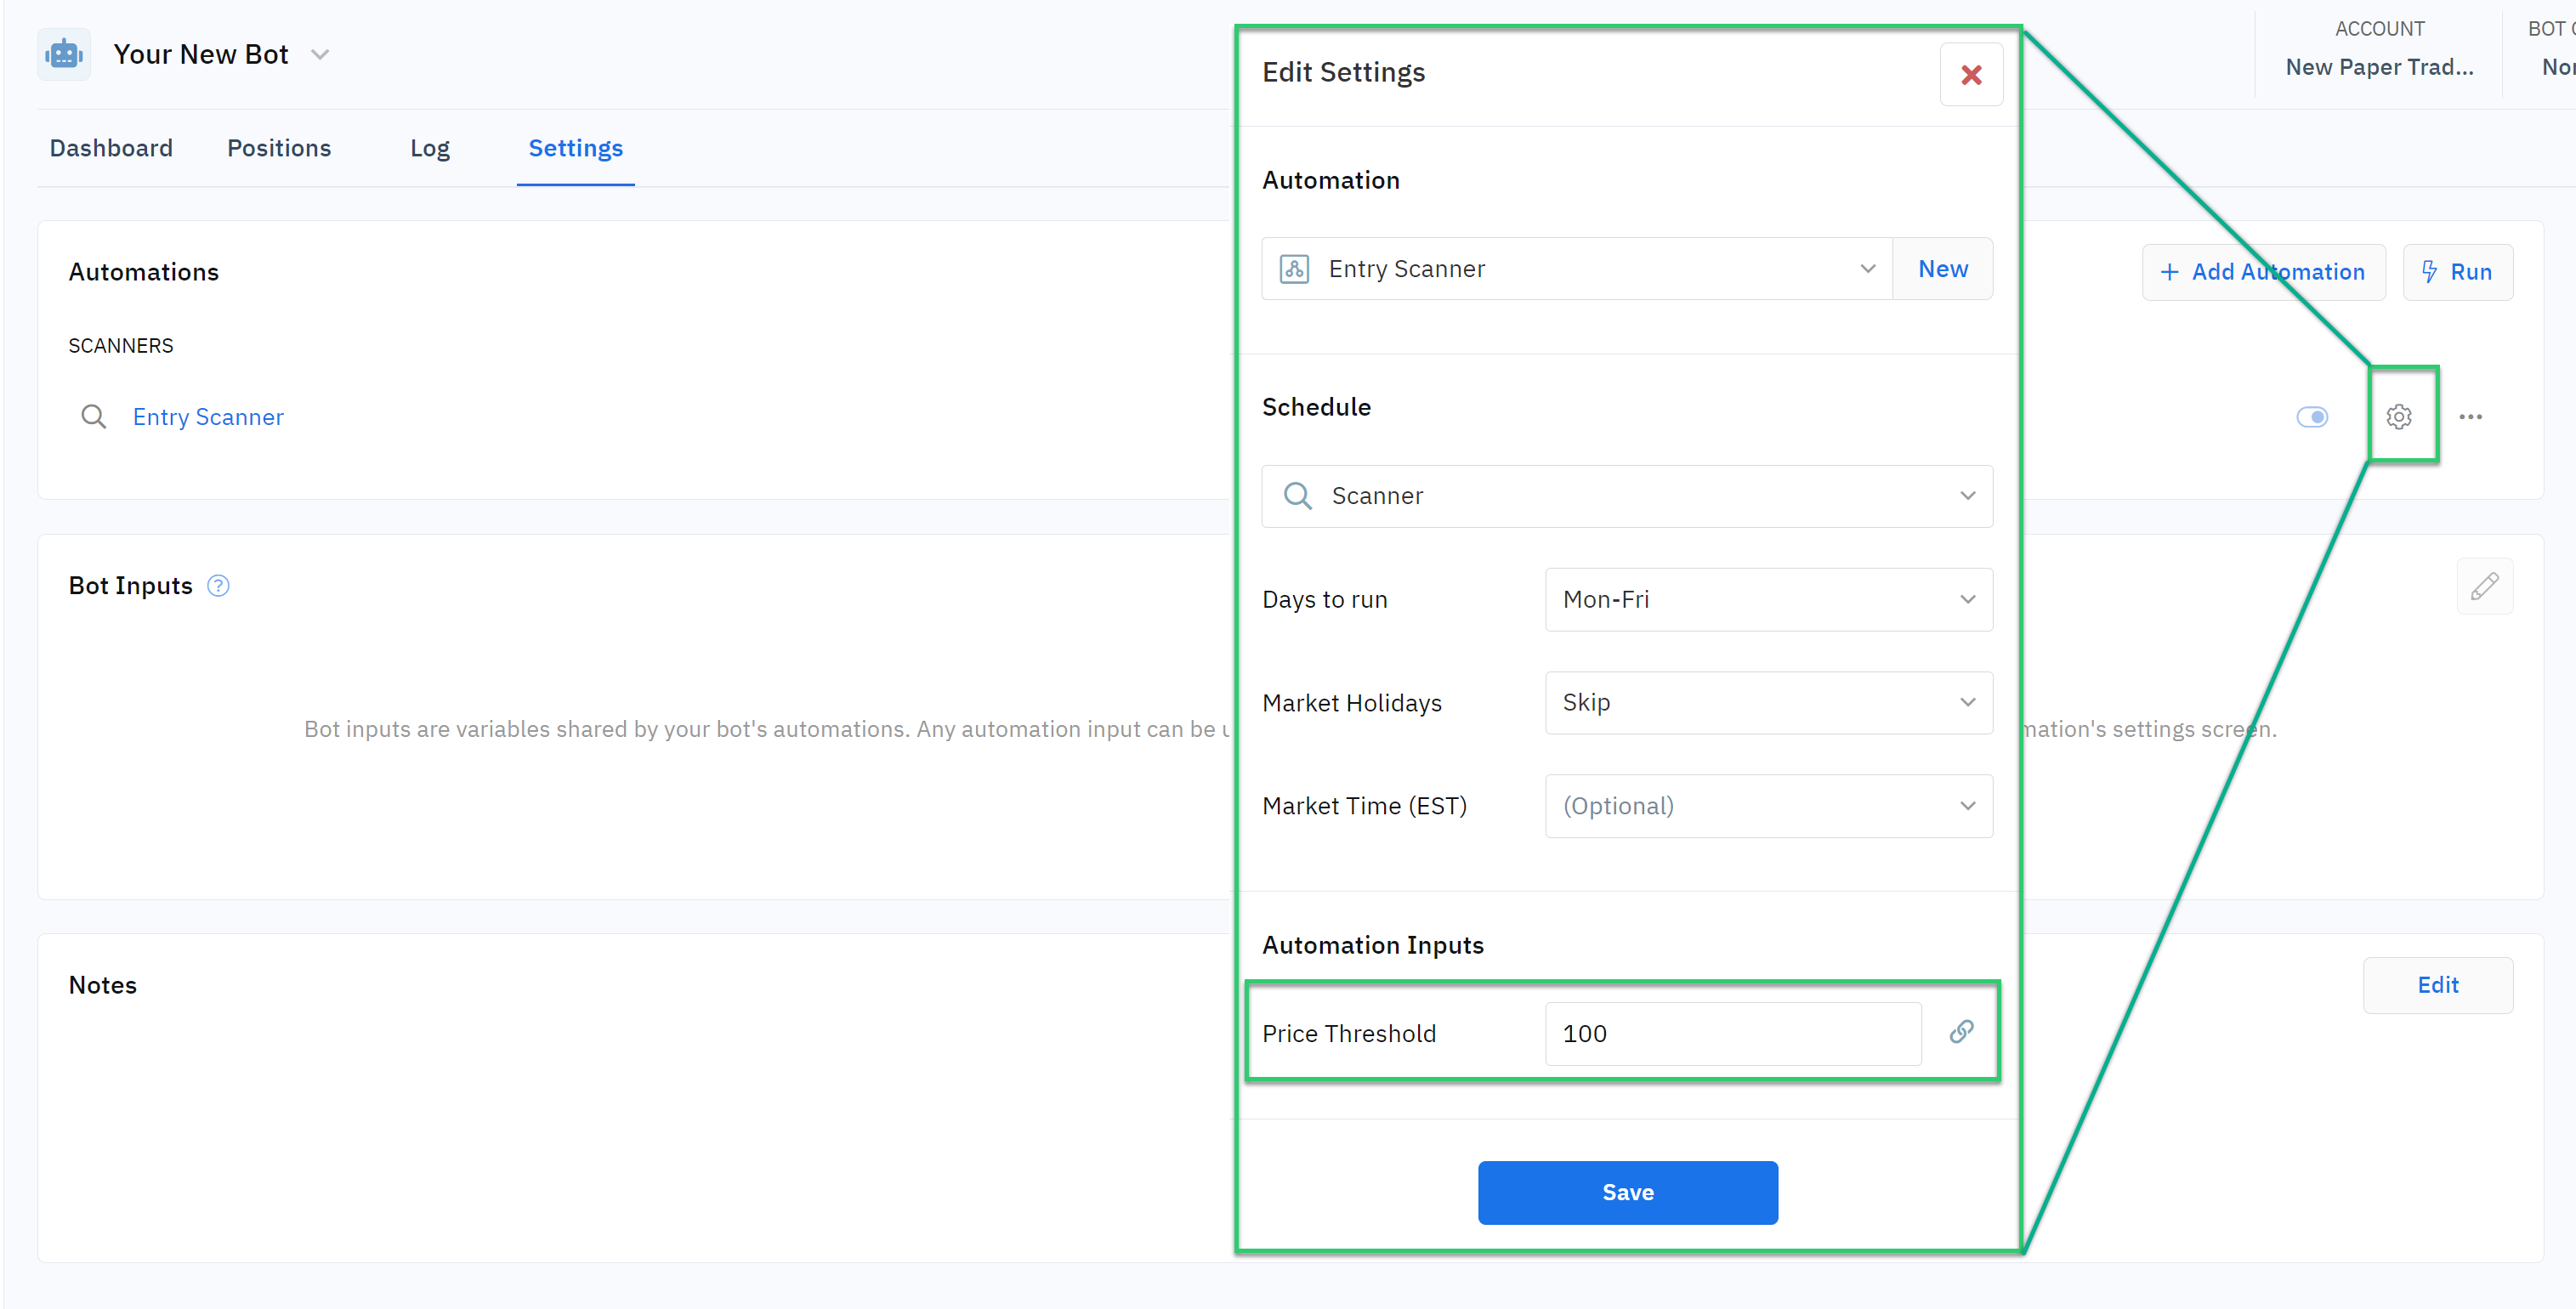
1\. Automation-Level Inputs: These inputs are defined within a specific automation. They can be modified directly in the automation's settings panel and will affect all instances of that input within the automation.

<figure><img src="https://2799944806-files.gitbook.io/~/files/v0/b/gitbook-x-prod.appspot.com/o/spaces%2F-MYjluAVRcRcfh1YL43z%2Fuploads%2FObQAMCBnIl4w6T8EVFoG%2Fimage.png?alt=media&#x26;token=10b40aaa-fff9-4780-93e2-3ba11dc4f620" alt=""><figcaption></figcaption></figure>

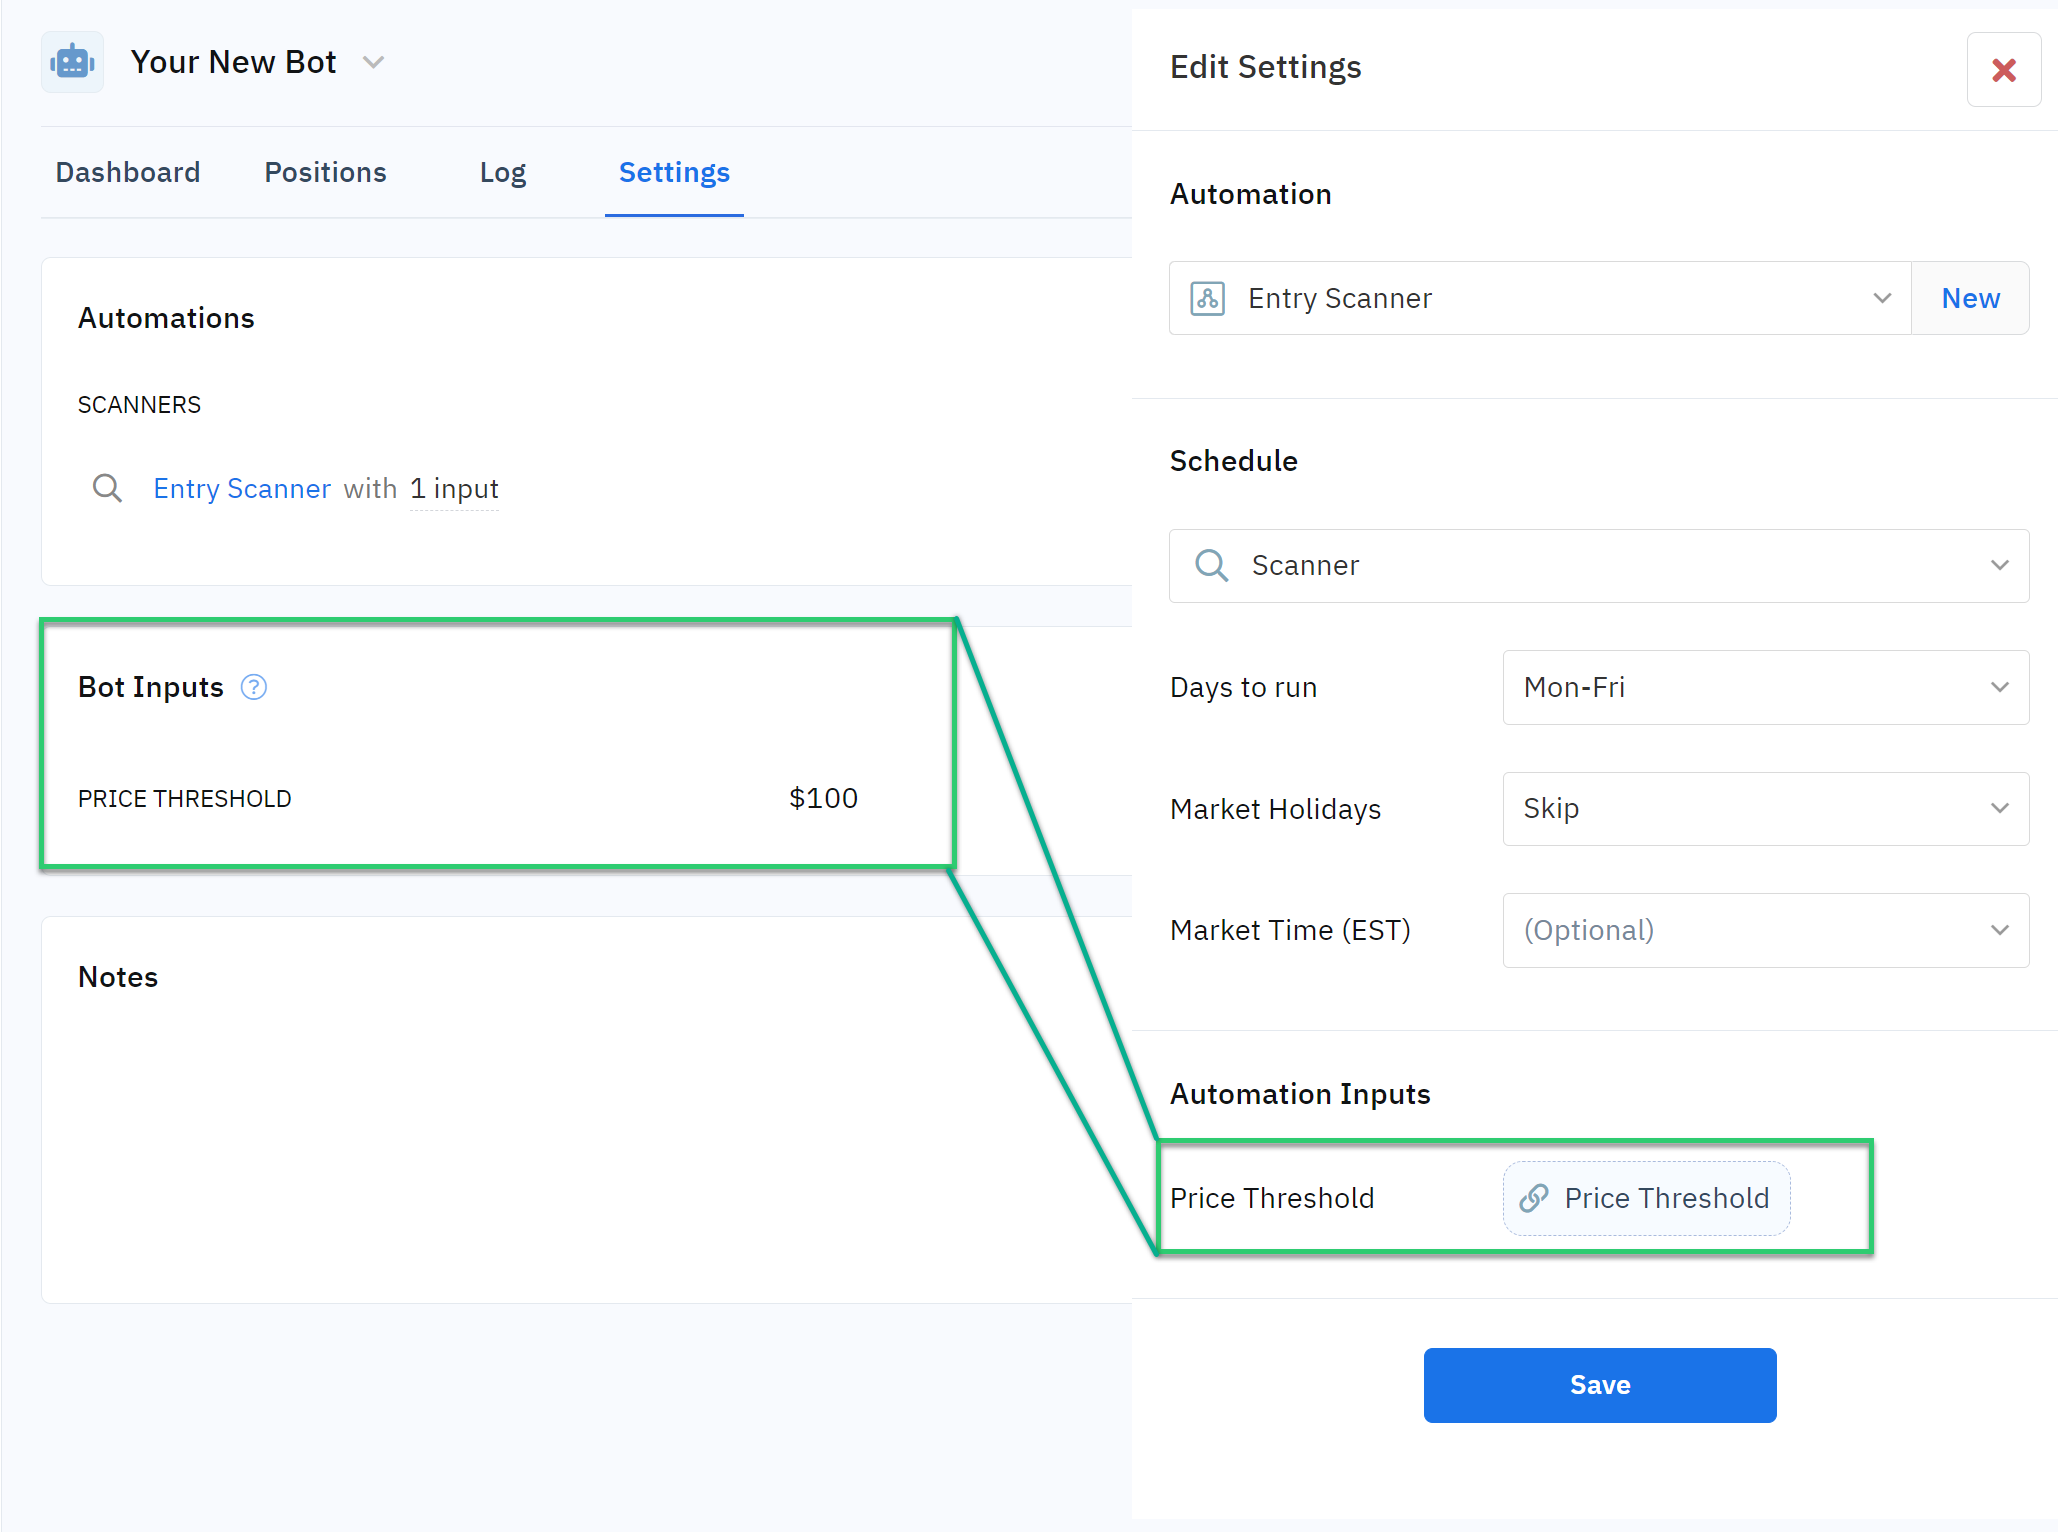
2. Bot-Level Inputs: These inputs are defined at the bot level and can be used across multiple automations within the same bot. Bot-level inputs allow you to manage key variables from a central location, the Bot Settings panel, providing a higher level of control and convenience. By moving an input from the automation level to the bot level, you can change values without diving into each individual automation.

<figure><img src="https://2799944806-files.gitbook.io/~/files/v0/b/gitbook-x-prod.appspot.com/o/spaces%2F-MYjluAVRcRcfh1YL43z%2Fuploads%2F8guzZ3DlSJloecJAU2Yu%2Fimage.png?alt=media&#x26;token=5bb77696-5c7b-4ec9-821d-c38e990909df" alt=""><figcaption></figcaption></figure>

#### Using Bot Inputs

{% embed url="<https://vimeo.com/1056824067>" %}

### What is the difference between a Decision Input, Automation Input, and Bot Input?

{% hint style="info" icon="medal" %}
(Thank you to community member [Robert DiNero](https://app.optionalpha.com/community/member/pachiraaquatica) for his contribution and help in [this post](https://app.optionalpha.com/community/posts/whats-the-difference-between-a-decisio-2026040221160)).&#x20;
{% endhint %}

We frequently get questions about users changing values, but the bot doesn't recognize the new values. Most often, this is due to the user changing the Default Value instead of the Automation Input value. Here are the 5 types of inputs and how they are used.

#### Decision Inputs

This bot example has one automation:

<figure><img src="/files/e6NYMBNARj3QJ6Rvjtgq" alt=""><figcaption></figcaption></figure>

That automation has one recipe that checks whether SPY is above $600. The $600 value is only used by that specific decision. We'll call that the Decision Value.

![](https://option-alpha.s3.amazonaws.com/uploads/177517715865510523951.png)

#### Automation Inputs

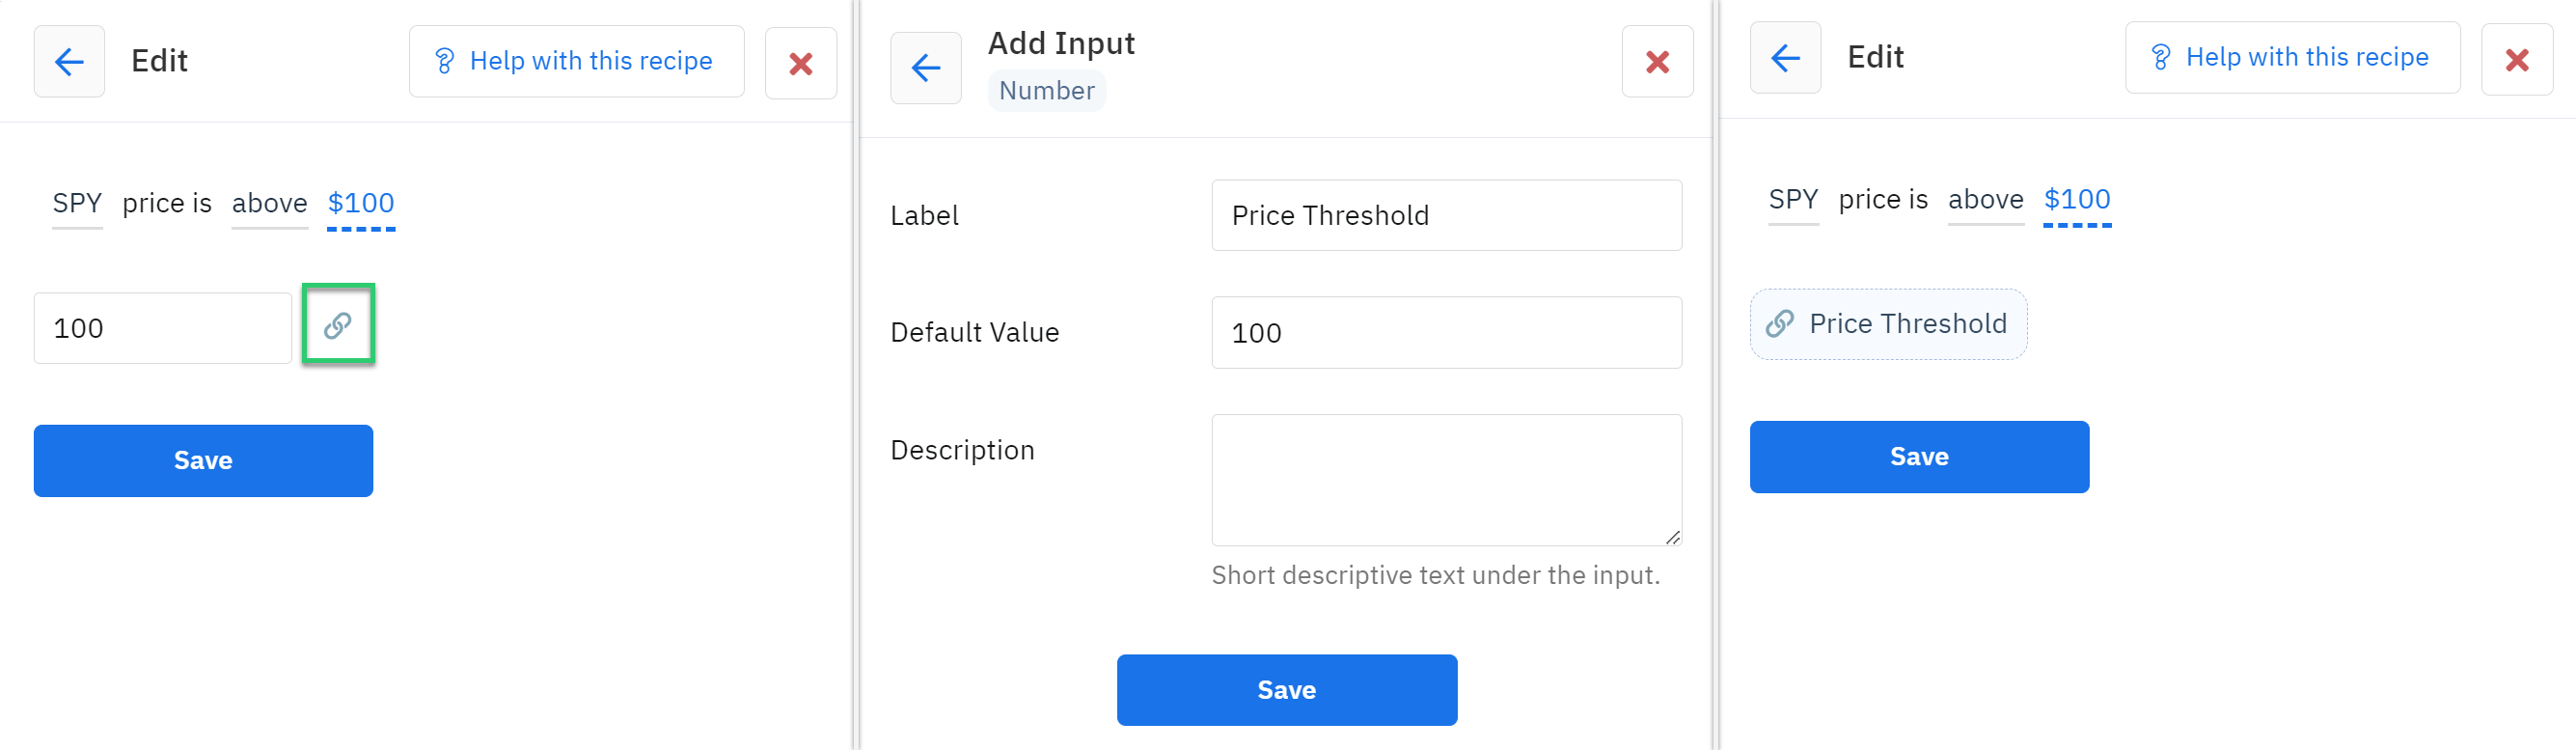
Inputs make it easier to change a value, especially if it is used multiple times within an automation. To add a **second recipe within the bot** that also uses the same price, you can create an **Automation Input** that can be used across multiple decisions within the same Automation (the "Automation" in "Automation Input"). Create the Automation Input when I link (🔗) the Decision Input to the Automation Input.

![](https://option-alpha.s3.amazonaws.com/uploads/177517319372019151121.png)

As there are no existing Automation Inputs that match that data type, add a new Automation Input called 'myAutomationInput'.

![](https://option-alpha.s3.amazonaws.com/uploads/177517722907114374371.png)

Give it a "Default Value" of 600. Important to note that at the time the input is created, the Default Value and the Automation Input value are the same value: 600.

![](https://option-alpha.s3.amazonaws.com/uploads/177517326229116762761.png)

You can see the list of Automation Inputs on the left side of the Automation. There is currently one Automation Input called 'myAutomationInput,' and it's used once in the automation. Click on that input to change the label, default value, and description.&#x20;

![](https://option-alpha.s3.amazonaws.com/uploads/177517329229215175161.png)

Click on the gear icon (⚙️) next to the automation to see the newly created 'myAutomationInput' and the value assigned to it: 600.

![](https://option-alpha.s3.amazonaws.com/uploads/177517351323615736321.png)

If you want to change the 'myAutomationInput' to 700, you can change that number in the **Settings of the Automation.**&#x20;

**THIS IS KEY!**

![](https://option-alpha.s3.amazonaws.com/uploads/177517363615715521371.png)

In the automation's Inputs, the Automation Input Default Value is still 600.

![](https://option-alpha.s3.amazonaws.com/uploads/177517369127717903341.png)

When running the automation, the bot uses the 700 value defined in the **settings** for 'myAutomationInput' (**not the Default Value**):

![](https://option-alpha.s3.amazonaws.com/uploads/177517382817715296431.png)

If you want to add another decision using 'myAutomationInput', you now only have to change the value in one location (the gear icon next to the automation name) when you want to change the value. The list of Automation Inputs now shows that there are two places in which that input is used within the automation.&#x20;

![](https://option-alpha.s3.amazonaws.com/uploads/177517461979812385761.png)

#### Bot Inputs

If you want to add a **second automation within the bot** that also uses the same value (as it is easier to change one value), you can create a [**Bot Input**](https://docs.optionalpha.com/tools/bots/inputs#using-bot-inputs) that can be used across multiple automations within the same bot (the "Bot" in "Bot Input"). Create the Bot Input when I link (🔗) the Automation Input to the Bot Input.

![](https://option-alpha.s3.amazonaws.com/uploads/177517408511513424801.png)

Because there are no existing Bot Inputs that match that data type, you can add a new Bot Input called 'myBotInput' and give it a "Default Value" of 650. Important to note that at the time the input is created, the Default Value and the Bot Input value are the same value: 650.

![](https://option-alpha.s3.amazonaws.com/uploads/177517417184614030341.png)

Now 'myAutomatonInput '(shared across multiple decisions) is linked to 'myBotInput' (shared across multiple automations)

![](https://option-alpha.s3.amazonaws.com/uploads/177517427209814100191.png)

![](https://option-alpha.s3.amazonaws.com/uploads/177517428462517926751.png)

Remember from above that **myAutomationInput** had a value of 700, which resulted in "false" when running the automation. Now, when running the automation with the link to **myBotInput**, which has a value of 650, the result is "true": SPY's price of 655.83 is above 650.

![](https://option-alpha.s3.amazonaws.com/uploads/177517486182712565281.png)

If you want the bot to use 675 in each decision and automation that's linked to myBotInput, change myBotInput to 675...

![](https://option-alpha.s3.amazonaws.com/uploads/177517509100311706421.png)

...and run the automation again, the result is false: SPY's price of 655.83 is NOT above 675.

![](https://option-alpha.s3.amazonaws.com/uploads/177517512490110736371.png)

Keep in mind the Bot Input Default Value is still 650. At this point you might say "what's the purpose of the Default Value if it's always ignored?". So let's talk about Default Values.

![](https://option-alpha.s3.amazonaws.com/uploads/177517520504614408131.png)

#### Default Values

Remember: the decision input is linked to the Automation Input, which is linked to the Bot Input - and the **Bot Input value takes priority**. The Default Values are not used UNLESS the Automation/Bot Input link **is broken.** To illustrate this, here is a second bot called mySecondBot.

![](https://option-alpha.s3.amazonaws.com/uploads/177517541870319600351.png)

This bot does not have any automations, so I'll "**copy to bot**" 'myAutomation'. Notice that when copying the automation to the new bot, there are no Bot Inputs.

![](https://option-alpha.s3.amazonaws.com/uploads/177517546026516598121.png)

However, when clicking on the gear icon next to the myAutomation you can still see that **myAutomationInput is linked to myBotInput**!

![](https://option-alpha.s3.amazonaws.com/uploads/177517552137117603761.png)

So the Decision Value is linked to the Automation Input. And the Automation Input is linked to the Bot Input. But the Bot Input is not defined anywhere.

So what happens when you run the automation? Which value will it use? When running the automation, the bot cannot find the Bot Input value and "defaults" to the Automation Input Default Value of 600.

![](https://option-alpha.s3.amazonaws.com/uploads/177517558308612651561.png)

**Upgrades**: Bot Inputs are **not** updated when you upgrade a bot. This is why you see the Bot Inputs screen - so you can compare your Bot Inputs with the author's new Bot Inputs.

If your bot isn't using the values you expect, start by looking at the log to see whether a Decision Input is used (hardcoded value) or an Automation Input is used (variable name). If an Automation Input is used, check the value located in the Automation Settings (not the default value inside the automation). If the Automation Input is linked to a Bot Input, check that the Bot Input is defined.

In addition, whenever you upgrade or clone a bot, make sure that you confirm the values for the Automation Inputs and Bot Inputs. Not only can this result in subpar performance for you, but it can also misrepresent the bot template's performance on the Top Bots page.

### Best Practices for Managing Inputs

Once you establish custom inputs, it’s crucial to manage them effectively to maintain the efficiency and flexibility they offer. Here are some best practices:

\- Avoid Editing Inputs Inside the Editor: Once an input is established outside the editor, whether at the automation or bot level, all changes to that input should be made in the respective settings panel. This ensures consistency and prevents errors that could arise from making changes directly within the editor.

\- Centralize Input Management: By moving key inputs to the bot level, you can manage them from the Bot Settings panel. This centralization simplifies the process of updating values and ensures that changes are applied consistently across all automations within the bot.

\- Reuse and Scale with Inputs: Inputs are especially useful when you plan to reuse an automation in different bots or scenarios. By defining inputs that can be easily modified, you can quickly adapt the automation to different contexts without reworking the entire setup.

Custom inputs are a powerful feature that can significantly enhance the efficiency and flexibility of your trading bots on Option Alpha. By understanding the input hierarchy and following best practices for managing inputs, you can streamline your trading processes, save time, and focus more on optimizing your strategies.<br>


# Tags

Tags are a powerful way to label your positions for easy identification and organize your bots' statefulness. Explore all the ways you can tag (and untag) your bots.

## Using Tags

The tagging system is a powerful tool that allows you to add data to your bots, positions, and symbols. This data can be used to track information, categorize items, and make decisions within your automations.

<figure><img src="https://2799944806-files.gitbook.io/~/files/v0/b/gitbook-x-prod.appspot.com/o/spaces%2F-MYjluAVRcRcfh1YL43z%2Fuploads%2FOf3KQd8S0MsaFCGsgsA3%2Fimage.png?alt=media&#x26;token=15607d01-004f-44d1-a7a0-dec19347c56d" alt=""><figcaption></figcaption></figure>

#### Types of Tags

There are three main types of tags:

* **Bot Tags:** Tags that are applied to your bot. They do not change state and remain applied to the bot unless reset or untagged by the user. Bot tags can be used to track the status of your bot, such as "actively hedging" or "avoiding high volatility".
* **Position Tags:** Tags that are applied to your open positions. They stay with the position and are helpful to determine what type of position it might be or other identifiers the user might want to know to manage and treat that position differently than others. For example, you could use a position tag to identify a "hedge" or a "core" position.
* **Symbol Tags:** Tags that are applied to your symbols. An example of this would be tagging a symbol based on an indicator reading like RSI Overbought.

#### Using Tags in Automations

Tags can be used in conjunction with decisions to create powerful and flexible automations. For example, you could use a bot tag to track the performance of your bot over time. You could use a position tag to identify a specific type of position, such as a "hedge" or a "core" position. You could also use a symbol tag to filter symbols based on certain criteria.

#### Tagging Options

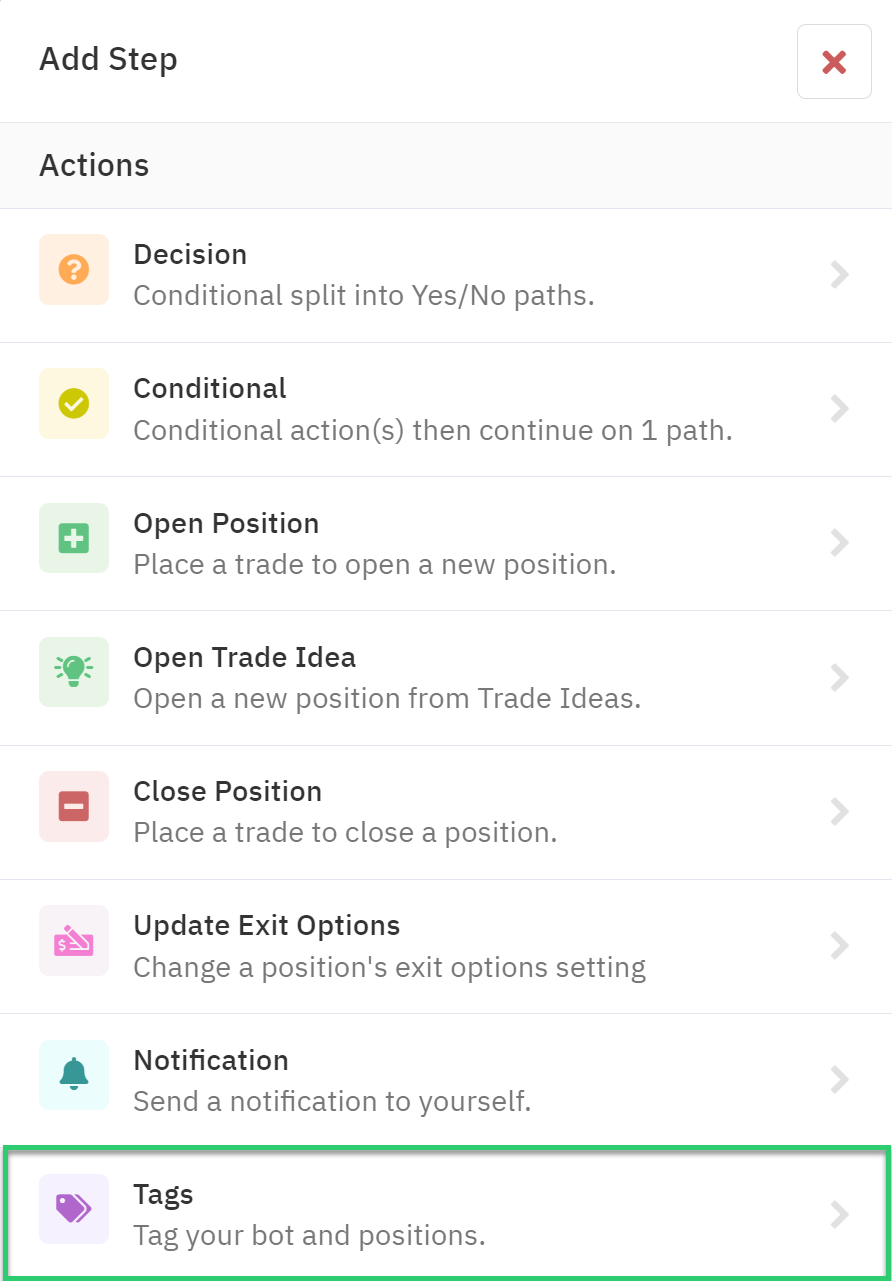
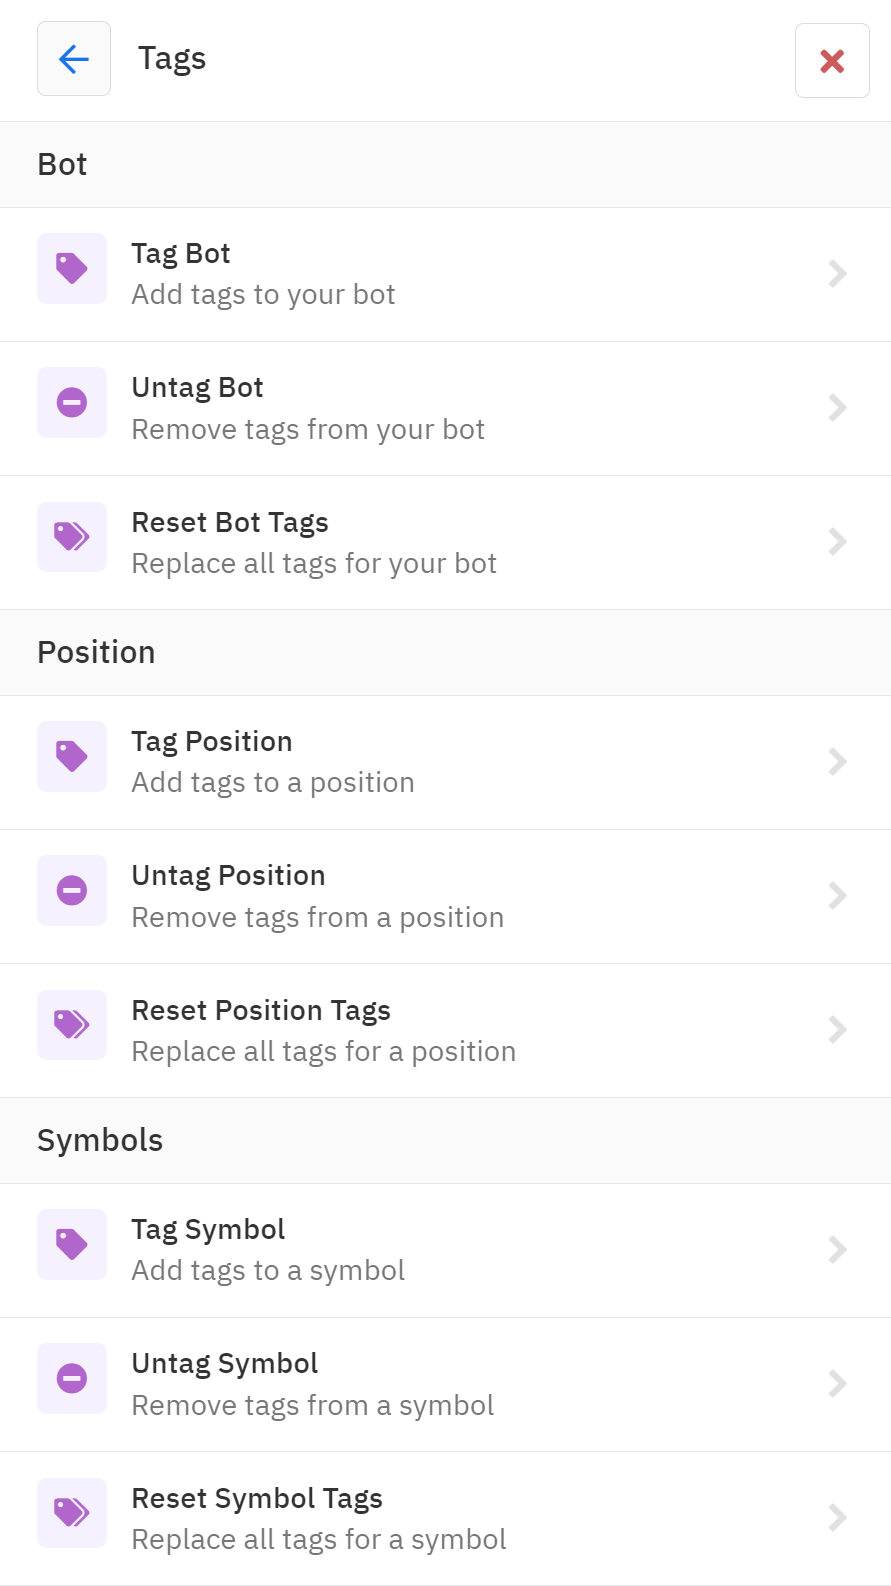
The tagging system provides the following options for adding and removing tags:

* **Tag Bot:** Add tags to your bot.
* **Untag Bot:** Remove tags from your bot.
* **Reset Bot Tags:** Replace all tags for your bot.
* **Tag Position:** Add tags to a position.
* **Untag Position:** Remove tags from a position.
* **Reset Position Tags:** Replace all tags for a position.
* **Tag Symbol:** Add tags to a symbol.
* **Untag Symbol:** Remove tags from a symbol.
* **Reset Symbol Tags:** Replace all tags for a symbol.

<figure><img src="https://2799944806-files.gitbook.io/~/files/v0/b/gitbook-x-prod.appspot.com/o/spaces%2F-MYjluAVRcRcfh1YL43z%2Fuploads%2F1WFZh2ANrE8aE3wX5iTZ%2Fimage.png?alt=media&#x26;token=b6d4ddec-aee7-441a-8c48-13960319a9eb" alt=""><figcaption></figcaption></figure>

**Tips for Using Tags**

* Use descriptive and consistent tags.
* Use a hierarchy of tags to organize your information.
* Use tags to track the performance of your bots and positions.
* Use tags to filter symbols based on certain criteria.
* Use tags to create custom reports and analytics.

The tagging system is a powerful tool that can be used to enhance the functionality of your automations. By using tags effectively, you can create more efficient, organized, and informed trading strategies.

{% embed url="<https://vimeo.com/745488537?fe=ci&fl=sv&share=copy>" %}


# Automation logs

Bot logs display your bot's detailed automation history and provide insight into its actions. Learn how to use bot logs to view your bot's activity and identify any errors or warnings.

## Bot Logs

Bot logs are an essential tool in the Option Alpha trading platform, providing a comprehensive record of every action your bot has taken. Whether you’re looking to troubleshoot an issue, or simply monitor your bot’s activity, the bot log is the fastest and most efficient way to gain insights into your bot’s behavior.

Bot logs offer a detailed automation history, allowing you to see exactly what actions your bot has taken—or not taken—during each automation run. This level of transparency is invaluable for both new and experienced traders, as it provides the information needed to refine strategies, ensure everything is functioning as expected, and quickly identify any issues that may arise.

{% embed url="<https://vimeo.com/1052336212>" %}

#### Filtering Bot Logs

Given the potentially large volume of data within a bot’s log, Option Alpha provides several filtering options to help you quickly find the information you need. Here’s how you can make the most of these filters:

1\. By Date: If you’re interested in reviewing your bot’s activity on a specific day, you can filter the log by date. This allows you to focus on the automation runs that occurred on that particular date, making it easier to investigate specific events or performance.

2\. By Type: Automation types such as Scanner, Monitor, Event, and Button can be individually filtered in the log. This is especially useful if you want to isolate the actions taken by a specific type of automation, allowing for more targeted analysis.

3\. By Errors or Warnings: One of the most powerful features of the bot log is the ability to filter by errors or warnings. This filter enables you to quickly identify any automation runs that encountered issues, allowing you to diagnose and resolve problems more efficiently.

#### Using Bot Logs to Improve Your Trading

Regularly reviewing your bot logs can provide valuable insights into your bot’s performance and help you make informed decisions about your trading strategies. By understanding which actions your bot is taking and identifying any errors or warnings, you can feel confident knowing how your bot is behaving.

Bot logs are a vital resource for anyone using Option Alpha’s trading platform. They offer a clear and detailed record of your bot’s activities, making it easy to monitor performance, troubleshoot issues, and optimize your trading strategies. By taking advantage of the filtering options available, you can quickly find the information you need to ensure your bots are operating smoothly and efficiently. Regularly reviewing your bot logs will help you stay on top of your trading activities and maintain control over your strategies.


# SmartPricing

Learn more about our incredible SmartPricing feature and how you can customize settings in any automation when sending orders to your broker.

## SmartPricing

SmartPricing places timed limit orders traversing the bid/ask spread to your final price. SmartPricing starts at the mid-price and works toward the bid when selling or ask when buying. SmartPricing attempts to fill the trade by submitting orders from the mid price to a "final price". The final price is the worst price you are willing to accept to fill the trade.

Each order will stay active at the broker for an amount of time based on the setting selected. Unfilled orders are canceled automatically and replaced with the next price in the sequence. The final price will stay active for two minutes and then cancel automatically.

The two controls you have over this functionality are the SmartPricing mode (e.g. Patient, Normal, Fast) and the "Final Price" (the worst price it should try).

You can choose from three SmartPricing settings (normal, fast, patient), turn SmartPricing off and use a single limit, or send a market order.

* **Normal** will try up to 4 prices, 10 seconds each.**‍**
* **Fast** will try up to 3 prices, 5 seconds each.
* **Patient** will try up to 5 prices, 20 seconds each.

<figure><img src="/files/S220xx5NFuRNVeDn5slA" alt=""><figcaption><p>Option Alpha SmartPricing</p></figcaption></figure>

#### Final Price

SmartPricing's Final Price settings allows us to customize the minimum or maximum price we're willing to let the bot to attempt. The final price is the final order your bot will send - your minimum price when selling or max price when buying.

{% hint style="info" %}
Profit Taking [Exit Options](/tools/managing-positions/exit-options) are a special scenario. You don't need to set a "Final Price" because the final price is automatically set by the bot to a price that locks in the profit you specified. It won't try a price worse than the one that would result in a profit less than your specified amount.
{% endhint %}

If more than one final price option is selected, the best price is used. If the bid/ask spread is narrow, the best price may be the ask when entering a trade. But we can also use the slippage from the mid-price setting to protect against price fluctuations. This allows the bot to trade even when bid/ask spreads get wide, while still controlling slippage.

{% hint style="info" %}
For example, if selecting 100% of the bid/ask and $0.10 from the mid-price, the best available price of the two will be used.
{% endhint %}

In the image below, the bid/ask spread is $22.30 -$23.00, with a mid-price is $22.65. The bot would have tried a final price of $22.55 ($0.10 from the mid), but did not continue all the way to the bid price of $22.30.<br>

<figure><img src="https://2799944806-files.gitbook.io/~/files/v0/b/gitbook-x-prod.appspot.com/o/spaces%2F-MYjluAVRcRcfh1YL43z%2Fuploads%2F1PIdPGhPvJrrCUrFGIDS%2Fimage.png?alt=media&#x26;token=8e3f7614-06e1-46f5-90b4-8d98e05815c1" alt=""><figcaption><p>Final Price settings</p></figcaption></figure>

If you select 100% as the final price of the bid-ask spread then SmartPricing goes from 50% (mid) to 100% (ask). If you select 75% as the final price of the bid-ask spread then SmartPricing goes from 50% (mid) to 75% (halfway between the mid and the ask).

If you limit SmartPricing to 50% as the final price of the bid-ask spread it will only attempt the midpoint price because the midpoint is 50% of the distance between the bid and ask by definition.

Bid (0%) - - - (25%) - - - Mid (50%) - - - (75%) - - - Ask (100%)

{% hint style="info" %}
Keep in mind you're selecting the "final price", not the percentage of the bid-ask spread that's used. SmartPricing always starts at the midprice.
{% endhint %}

We can also use a math operator as a final price setting inside a 'Close Position' action in automations. The final price value references the position’s opening entry price to arrive at a final limit price to exit the position.

<figure><img src="https://2799944806-files.gitbook.io/~/files/v0/b/gitbook-x-prod.appspot.com/o/spaces%2F-MYjluAVRcRcfh1YL43z%2Fuploads%2FN5gkMWRvcjFt0KWEsuf3%2Fimage.png?alt=media&#x26;token=b7928225-adc2-413d-b539-a3c9503e5f9e" alt=""><figcaption><p>SmartPricing Final Price position trade price math operator</p></figcaption></figure>

For example:

A **x 1.15** multiplier would close the trade with a 15% or better profit for a debit type trade.

A **+ 2.50** addition would close the trade with $250 or better profit per contract for a debit type trade.

A **x 0.50** multiplier would close the trade with a 50% or better profit for a credit type trade.

A **- 0.75** offset to the position’s opening price would close the trade with a $75 or better profit per contract for a credit type trade.

#### SPX SmartPricing

SmartPricing calculates the prices based on several points across the bid/ask spread. For example: mid, 1/3, 2/3, final price.

In the case of SPX, the prices at the fractions in the middle are rounded up or down to the nearest nickel ($0.05) depending on whether you are selling or buying.

<figure><img src="https://2799944806-files.gitbook.io/~/files/v0/b/gitbook-x-prod.appspot.com/o/spaces%2F-MYjluAVRcRcfh1YL43z%2Fuploads%2F8XJSDN6BR9WZCVihaMNV%2Fimage.png?alt=media&#x26;token=2d367fec-4f90-4ee0-9943-7ce8b1379b80" alt=""><figcaption><p>SPX SmartPricing example</p></figcaption></figure>

For example, if the bot is using the 'normal' SmartPricing setting to open an SPX short put spread with a $0.50 wide bid/ask spread, it will start at or near the mid price and send timed limit orders as it traverses toward the bid as optimal as possible. $0.25 cannot be evenly distributed four ways, so SmartPricing automatically adjusts the spacing of the orders.

<figure><img src="https://2799944806-files.gitbook.io/~/files/v0/b/gitbook-x-prod.appspot.com/o/spaces%2F-MYjluAVRcRcfh1YL43z%2Fuploads%2FpeHh3DkWBxgdzeMNCIG2%2Fimage.png?alt=media&#x26;token=9947f6f7-9e49-40f7-b701-c2b49f3d3f5c" alt=""><figcaption><p>SPX SmartPricing example</p></figcaption></figure>

SmartPricing rounds automatically to the nearest nickel increment price (rounds up when selling, down when buying). In the above example, the final price is set to $4.23, so the bot rounds up to $4.25 and will not try a price below that.

The fill price is the mid of all legs added together. In the case of SPX which can only fill legs in nickel increments, it can result in a mid that is not actually in the middle of the bid/ask.

For example, an SPX call with a bid/ask of $0.10 - $0.15 the mid price is $0.15 when buying, $0.10 if selling since there is no valid price in between the spread. When you apply that same rule for all legs of a multi-leg position, you can end up with a mid price that is not very intuitive.

#### SmartPricing example

The Final Price setting is available on all position opening actions (e.g. Open Position, Open Trade Idea, etc), the Close Position action and each Exit Option setting. The default is to try filling the trade at a price up to 100% of the bid/ask spread, which looks like this:

<figure><img src="https://cdn.prod.website-files.com/5fba23eb8789c3c7fcfb5f31/67aa548951cf25fcc56463c4_173919722467618382711.png" alt=""><figcaption></figcaption></figure>

In this case the bot will start with an order at the mid price and try up to a total of four different prices before it makes it to the "Final Price", which is set to 100% of the bid/ask spread.

If you click the "Price" field, you have the option to control the "Final Price" the bot will try to get the order filled at, for example:

<figure><img src="https://cdn.prod.website-files.com/5fba23eb8789c3c7fcfb5f31/67aa54896f31a784c25478b2_173919736023415575401.png" alt=""><figcaption></figcaption></figure>

If you select more than 1 Final Price option then the best price is selected as the final price to try to get filled at. For example, you could select:

<figure><img src="https://cdn.prod.website-files.com/5fba23eb8789c3c7fcfb5f31/67aa548a7f33619ddb303862_173919755139116957321.png" alt=""><figcaption></figcaption></figure>

Which would make it use whichever is the "best" fill price for you out of those 3 options.

You can see a log of the values at the time of the trade in the trade log here:

<figure><img src="https://cdn.prod.website-files.com/5fba23eb8789c3c7fcfb5f31/67aa548991084a6deb8e2465_173919785029016097271.png" alt=""><figcaption></figcaption></figure>

This was selling a short put credit spread, so the "best" price of the 3 selected options was $2.34 from the "120% of typical slippage" option and that was used as the Final Price to try to get filled at.


# Webhooks

Webhooks allow traders to link to external platforms and trigger automations using custom trading signals, technical indicators, email alerts, and more.

With Webhooks, we can now link our Option Alpha automations with the indicators and signals from some of the most popular charting platforms and applications. The addition of webhooks is a solution for traders in the community who want to use more indicators, custom signals, intraday timeframes, and email-based trade alerts.

Imagine triggering an automation to enter or exit a trade based on a custom indicator from TradingView or a trendline break on TrendSpider. With Webhooks, it’s now incredibly easy to set up these – or any other highly specific scenario you can dream up. Plus, it doesn’t just stop there, because you can also use external software services like Zapier, which enables you to convert signals received by email or any number of other sources into an outgoing Webhook headed straight to your bots.

### What is a Webhook?

A webhook makes it possible for two unconnected systems to communicate with each other. The webhook is the link between the platforms. For example, if something happens in 'System A' (such as a indicator-based trading signal) it can trigger something happening in 'System B' by calling the webhook (like running an automation in Option Alpha to open a position).

A Webhook allows you to trigger automations within Option Alpha from any external source you choose. This means we can now connect our Option Alpha account with other platforms like TradingView, Zapier, Python, and much more.

Trigger an automation to run inside Option Alpha from anywhere, for any reason; the possibilities are endless!

<figure><img src="/files/IyPRlQUAk10bqFPGIM1R" alt=""><figcaption></figcaption></figure>

### Trigger automations using indicators and charts

There are many different ways we can use automations inside our bots. We can run them at continuous intervals, schedule them for a specific date and time, and now trigger them if a webhook is called from an external source, meaning an automation can run at any time based on a wide variety of alert signals.

One of the most exciting aspects of webhooks is the ability to use any indicator available on our favorite trading platforms. We’re no longer limited to the indicators within Option Alpha; we can now leverage the full suite of tools and analytics from other services to trigger trading signals and expand our opportunities. This, of course, includes any intra-day indicators from smaller timeframe charts.

{% hint style="info" %}
If you clone a bot that uses a Webhook automation trigger, the webhook will persist since it can be shared among bots.
{% endhint %}

### How to use Webhooks in Option Alpha

Getting started with Webhooks is simple and straightforward.

1. Create a new webhook URL in your Option Alpha account
2. Schedule an automation to run when the webhook triggers
3. Copy/paste the unique URL into an external platform
4. Define the criteria to call the webhook

#### Create a new Webhook URL

Create and name your new webhook inside your Option Alpha Settings:

<figure><img src="/files/ZYZdTCi8Bv475HETNH4E" alt=""><figcaption></figcaption></figure>

Or when creating a New Automation in a bot's Settings tab:

<figure><img src="/files/4Z7cVFVityQi0Psvr8XD" alt=""><figcaption></figcaption></figure>

#### Schedule your automation trigger**‍**

In your bot’s Settings, add the automation you want to run when your webhook is called, and select ‘Webhook’ from the available triggers. When your webhook is called, the automation will run instantly. A webhook can trigger up to 10 automations in a single bot, and a webhook can trigger automations in multiple bots.

<figure><img src="/files/8jD0HD0dT4ApFI0J08oy" alt=""><figcaption></figcaption></figure>

Copy the webhook's unique URL code to paste into an external platform.

<figure><img src="/files/ByYNChc9UuyNn65AOvYh" alt=""><figcaption></figcaption></figure>

**‍**Once your webhook is set up, you can sit back and let Option Alpha handle the execution of your trading strategy based on the real-time data from your connected sources.

Your automation can evaluate additional market criteria, position filters, opportunity checks, and more. Or, it can simply open a position. It can even run alongside other automations. You have full control to customize your webhooks and automations to accomplish your strategy goals.

#### Connect to an external source**‍**

**‍**Paste the custom URL to connect your Option Alpha account with the external platform of your choice. This may involve entering the URL into the webhook settings of TradingView, TrendSpider, or your email-based signal service.

Here is an example from TradingView…

Click on the Alert Button, then on the Notifications tab and paste your unique URL into the field:

<figure><img src="/files/NbT3XS3M9GlDwLliJanT" alt=""><figcaption></figcaption></figure>

#### Define your alert criteria

**‍**Specify the conditions under which the Webhook should trigger an automation. This could be a particular indicator crossing a threshold, a specific chart pattern being recognized, or a trade signal email being received.

For example, this webhook would be called if SPY's 9-day SMA crossed above the 21-day SMA, trigger an automation of your choice in Option Alpha:

<figure><img src="/files/k0pKYtKb5xZVbFHkcnUr" alt=""><figcaption></figcaption></figure>

Here is a short, step-by-step guide to follow along with as you create a new webhook in Option Alpha and connect it to an a 3rd-party platform.

{% embed url="<https://scribehow.com/viewer/Using_TradingView_Indicator_to_Open_a_Position_in_Option_Alpha__ZFU8kHxCTpKA4Q0fIo5PPw?referrer=documents>" %}

<sub>\*Option Alpha is not affiliated with TradingView, Zapier, or Python, and does not endorse any specific strategy, indicator, or alert. All examples are provided for demonstration purposes only.</sub><br>


# Finding Trades

Explore the different tools we can use to find potential trading opportunities, both manually and with automation.


# Scanners

Use automation to scan the market, evaluate opportunities, check technical indicators, open positions, and much more.

{% embed url="<https://vimeo.com/1052337610>" %}

Scanner automations typically begin with a [symbol loop](/tools/bots/loops) and a subsequent list of one or more [decisions](/tools/bots/decision-actions), ending with an 'Open Position' action.

Here is an example of a scanner that evaluates the market and opens a bullish or bearish credit spread depending on the current conditions:

<figure><img src="/files/h4UVbPPFxjDvUELMXtpu" alt=""><figcaption></figcaption></figure>

### Open Position action

The 'Open Position' action includes all the position's details, including the symbol, expiration, strike prices, position sizing, [SmartPricing](/tools/bots/smartpricing) settings, [Exit Options](/tools/managing-positions/exit-options), and any [tags](/tools/bots/tags) you may want automatically applied to the position that is opened.

<figure><img src="/files/fEds8d0b58mSKTFwMger" alt=""><figcaption></figcaption></figure>

We can also define one or more entry criteria:

<figure><img src="/files/henDvoLe6fGS1DkHDJMj" alt=""><figcaption></figcaption></figure>

As well as position criteria to set minimum and maximum values for specific variables, which the bot will filter out if your criteria aren't met:

<figure><img src="/files/H3PUvQbppKltIuWHG1wM" alt=""><figcaption></figcaption></figure>


# Trade Ideas

## Trade Ideas

Trade Ideas helps us find trades with an edge based on expected value (EV) and probabilities. Trade Ideas displays opportunities in the options market in a convenient way to analyze the potential profitability of a position vs the potential risk associated with the position.

Trade Ideas ranks spreads for profitability from a subset of all optionable symbols available to trade at Option Alpha (see the full list of Trade Ideas symbols [here](/technical-documentation/platform/supported-ticker-symbols)). The symbols are selected each day based on ranking factors like liquidity, signal quality indicators like overall spread width, and outlier filtering.

#### How it works

The Trade Ideas backend scans continuously during market hours (9:35am - 3:55pm) and finds trade ideas in 3 ways:

1. It analyzes the returns of thousands of position setups used by all of us (underlying symbol, leg deltas, days to expiration, etc) and loads the current market data for the top performing position setups and compares them looking for opportunities using Reward/Risk, EV (expected value) and Alpha (EV / Max Loss).
2. It examines every option series expiring in 45 days or less that falls on a Friday and matches up every possible combination of legs at various delta values (.50, .45, .425, .40, .375, .35, .325, .30, .275, .25, .20, .15, .10) looking for opportunities.
3. It examines all current open positions in the platform looking for opportunities.

Trade Ideas analyzes all combinations of legs in a given option chain for a given underlying continuously throughout the day. Each combination of legs represents a tradable opportunity that is evaluated for suitability and inclusion in the Trade Ideas list. Every trade analyzed increases the overall count.

After \~1 minute a Trade Idea quote is considered stale. It is discarded and the process starts over again, reevaluating all possible combinations.

{% embed url="<https://vimeo.com/1052338353>" %}

### Trade Idea Actions

Option Alpha offers two primary types of Trade Idea Actions:

* Multi-Symbol Actions: These actions incorporate a built-in symbol loop, allowing you to search for credit or debit spreads across multiple symbols and strategies.
  * Find Credit Spread
  * Find Debit Spread
* Single Symbol and Strategy Actions: These actions are specific to a particular symbol and trading strategy, providing focused trade discovery. Actions are available for all strategies except Long Equity.

<figure><img src="/files/AVVQxaLvvISecFU31Zkl" alt=""><figcaption></figcaption></figure>

#### EV (Expected Value)

EV is a weighted average of all possible outcomes of a trade that serves as a powerful tool for decision-making and risk assessment.<br>

EV represents the expected average $ profit per contact of a trade if you were to make that trade consistently over a long period of time. Similar to a casino's house edge, the more you make trades with a positive EV, the more likely you are to be profitable over time.

To ensure we have the most accurate EV possible, we calculate the probability and associated payoff **for every profit/loss scenario between the strike prices** in $0.01 increment&#x73;**.**

[**Learn how we calculate EV and Alpha**](/technical-documentation/calculations/understanding-alpha-and-expected-value)

#### Alpha

Alpha represents the expected average % return on risk per trade if you were to make that trade consistently over a long period of time. Many times higher EV also means higher $ risk making it difficult to compare multiple positions using EV alone without additional math. Alpha solves this by normalizing EV into a return on risk % which can be used to compare the expected outcomes of positions with different risk profiles.*\\*

*Alpha = EV / Max Loss*

> *‍*For example, #1 position with $5 EV and $50 max loss vs #2 position with EV $25 and $250 max loss. Is #2 with $25 EV better? Both are equal since you can open quantity 5 of #1 to get the same $25 EV with the same $250 at risk. Alpha normalizes both trades into the same value ($5 / $50 = 10%) and ($25 / $250 = 10%) for sorting and comparison.

#### Reward/Risk %

Measures the potential return of an investment against its potential loss. Typically, the higher the reward/risk, the lower probability of max profit.

*Reward/Risk % = Max Profit / Max Loss*

#### Filter all Trade Ideas

You can easily organize millions of trade ideas with a few key filters. Select one or more filters to focus your search:

* **Watchlist** - Focus on your favorite tickers only. You can add and remove tickers in your Watchlist at any time.
* **Symbols** - Include or exclude symbols to customize your search to specific tickers.
* **Strategy type** - Filter for bullish short put spreads, bearish short call spreads, and neutral iron condors.
* **Symbol type** - Filter for ETFs only. The default setting displays all stocks and ETFs available for autotrading.
* **High IV** - Select the High IV filter to see symbols with an IV Rank above 50.
* **Days until expiration** - Refine your search for multiple target DTE timeframes.
* **Avoid earnings** - Automatically filter any trade to avoid or target earnings. View Trade Ideas for tickers that have upcoming earnings. "Avoid earnings" will filter any positions that have an earnings announcement between today and position expiration to minimize risk exposure. Example: TSLA reports earnings in 9 days. Positions with more than 9 days to expiration will have an earnings announcement while holding the position (more risk). Positions with less than 9 days do not cross an earnings announcement, so they are displayed.
* **Probabilities** - Filter trades using their probability of profit (POP), probability of max profit (PMP), and probability of max loss (PML). Select from one or more percentile ranges in each column.

#### Sort remaining ideas

You can sort and rank Trade Ideas for each column to find potential opportunities based on different preferences. All columns can be sorted by reverse order (highest to lowest or lowest to highest). Note that all data is updated every minute. Pricing and probabilities can change rapidly.

* **Position** - You can always click on a ticker to see more information about the ticker symbol.
* **Leg/Delta** - See the strike price and live delta of the trading opportunity.
* **DTE** - Sort trades by their days until expiration. Hover your mouse over the DTE to see the position's expiration date.
* **Max profit** - To know how much you can make on a trade, sort trades by the highest potential profit. Max profit represents the original credit received and is based on the underlying symbol expiring out-of-the-money.
* **Max loss** - If knowing how much you can lose on a trade is more important, sort trades by their max loss potential. Max loss represents the spread width minus the original credit received. All probabilities are based on the underlying's price at expiration.
* **Reward/Risk** - The reward/risk shows you your profit potential relative to the max loss. Reward/risk is calculated by dividing the max profit by the max loss. For example, a $6 wide credit spread with a $150 max profit and a $450 max loss has a reward/risk of 33%. The trade is risking $450 to make $150.
* **Probability of profit (POP)** - Probability of profit is the % chance the trade will make money. The probability of profit is automatically calculated based on the trade's break-even price(s). Probabilities above 50% are shaded green and probabilities below 50% are shaded red. Probabilities are calculated at trade entry assuming the position is held until expiration.**‍**
* **Probability of max profit (PMP)** - Probability of max profit is the % chance the trade will realize the full profit. The probability of max profit calculates the chance that all options will expire out-of-the-money. Probabilities are calculated at trade entry assuming the position is held until expiration.**‍**
* **Probability of max loss (PML)** - Probability of max loss is the % chance the trade realizes a full loss. The probability of max loss calculates the chance that a spread will expire in-the-money. Probabilities are calculated at trade entry assuming the position is held until expiration.**‍**
* **Alpha** - A proprietary calculation to help rank opportunities. We continue to monitor and tweak the calculation and may share details once we have a final formula.**‍**
* **IV Rank** - Sort all ideas by IV Rank. Quickly and easily find symbols with high or low IV Rank.**‍**
* **Earnings** - Rank trades by when earnings are to be announced next. Easily compare DTE to the next earnings date. Days until the earnings announcement is shaded red. Hover your mouse over the red box to see how long after earnings the position expires.**‍**
* **Traders** - This shows how many Option Alpha traders are currently trading that particular position.

<figure><img src="https://2799944806-files.gitbook.io/~/files/v0/b/gitbook-x-prod.appspot.com/o/spaces%2F-MYjluAVRcRcfh1YL43z%2Fuploads%2FfTf2XjXY08HHrSC1Ie2G%2Fimage.png?alt=media&#x26;token=7df841fd-429c-44bd-9be1-ed98331fe7f0" alt=""><figcaption></figcaption></figure>

#### Select a position to trade

Select your position to see the trade's details. The New Position screen displays all your trade's information, including the symbol, strategy type, expiration, and option legs. You can always edit any of the variables on this page. Note that changing the inputs will alter pricing and probabilities. All new information is immediately displayed using real-time live market data.

#### Confirm Order Details and SmartPricing

Adjust your contract quantity, set your Final Price, and choose your SmartPricing setting. The Final Price is the price for the final order placed by SmartPricing. It is the minimum price when selling or the maximum price when buying. The default price displayed is 100% of the bid-ask spread.

You can select from five SmartPricing settings:

* **Normal** - tries up to 4 prices, 10 seconds each.
* **Fast** - tries up to 3 prices, 5 seconds each.
* **Patient** - tries up to 5 prices, 20 seconds each.
* **Off** - turn off SmartPricing and submit a single limit order.
* **Market** - send a Market Order.

The final order is automatically canceled after two minutes if it is not filled.

<figure><img src="https://2799944806-files.gitbook.io/~/files/v0/b/gitbook-x-prod.appspot.com/o/spaces%2F-MYjluAVRcRcfh1YL43z%2Fuploads%2Fk7TQPhKmFmnApLrtkpBP%2Fimage.png?alt=media&#x26;token=44471ca3-75bb-4bc6-ba00-d4f39d954ec1" alt=""><figcaption></figcaption></figure>

#### Select a bot

All positions must be assigned to a bot. You can select an existing bot or create a new bot by clicking the '+' icon. Choose a paper trading bot or a live bot connected to your broker. Live bots will send an order to your broker to execute the trade in your account immediately after clicking 'Place Trade.'

#### Exit Options

Pre-set your position's management with 1-minute Exit Options. Define your profit target, stop loss, and expiration/earnings filters.

Trade Ideas is a great tool for options traders who want a better way of finding trading ideas without spending hours on researching trades. It gives you timely position-level data to make informed decisions about your trades without all the guesswork.

<figure><img src="https://2799944806-files.gitbook.io/~/files/v0/b/gitbook-x-prod.appspot.com/o/spaces%2F-MYjluAVRcRcfh1YL43z%2Fuploads%2FWnjc8FremSK1nUZi3f8I%2Fimage.png?alt=media&#x26;token=3dc40d50-0194-4465-a0d6-cdb15392ed2f" alt=""><figcaption></figcaption></figure>

{% hint style="info" %}
We have published multiple [Research Insights blogs](https://optionalpha.com/category/research-insights) to analyze how pre-trade EV and Alpha values compare to realized P/L results using Trade Ideas positions.
{% endhint %}


# 0DTE Oracle

0DTE Oracle is a tool that helps us find and analyze 0DTE and next day trading opportunities.

## 0DTE Oracle

0DTE Oracle is a new tool that helps us find and analyze [0DTE](https://optionalpha.com/learn/0dte) and next day trading opportunities. It aims to solve the problem of probabilities and expected value (EV) being less accurate for 0DTE trades by providing backtest results to help identify quality trades instead of relying on probabilities.

Each trade's metrics are backtested against the underlying's previous 1 year of intraday minute data to see how trading a similar position daily would have performed over that time.

Similar to Trade Ideas, it analyzes the trades currently available in the market to produce a list of actionable trade opportunities.

{% embed url="<https://vimeo.com/1052335694>" %}

### Why We Love It

We have been testing this tool internally and the team is hooked. The ability to quickly find and place quality 0DTE trades empowers us with the confidence to trade daily. We hope you will feel empowered as well. Here are some of the things we like about it:

* Quickly choose between 0DTE and next day trades ranked by backrest results
* Time consuming analysis done in advance - including the ability view and rank many different leg combinations at a glance
* New positions available every day based on time of day and current market opportunities
* Backtest results give new insight into how 0DTE trades perform over time
* SPX available with cash settlement to avoid assignments and favorable tax treatment
* Run custom backtests to see how positions perform in specific market conditions

### Why We Created It

As part of our[ internal research](https://optionalpha.com/category/research-insights) we discovered the probabilities for shorter duration trades, particularly 0DTE and next day trades, are less accurate than longer duration trades. We believe this is because the time component of the [Black-Sholes model ](https://optionalpha.com/blog/black-scholes-model-option-alpha-uses-historical-volatility-to-calculate-expected-value)used to calculate the probabilities is too short. The inaccuracy of probabilities causes other metrics that depend on it, e.g. expected value (EV) and alpha, to be less accurate as well.

Since pre-calculated math and probabilities are a fundamental part of removing bias and quick decision making in Options Trading 2.0, the inaccuracy of probabilities makes finding quality 0DTE and next day trading opportunities challenging. A recent addition to the platform, Earnings Edge, solved a similar issue for earnings reports by backtesting the trades currently available in the market across the previous 5 years of earnings reports.

This sparked the idea for the 0DTE Oracle. It analyzes the 0DTE trades currently available in the market and backtests them against the previous 1 year of intraday minute pricing data to see what would have happened if you traded this position every day, with the exact same metrics, at this time of day, and held to expiration. It presents the best opportunities in an actionable list to sort and filter to find a quality trade based on your criteria.

You can also run custom backtests on up to 3 years of minute data and apply entry conditions and filters to see how it would have performed under custom market conditions.

#### Key Assumptions and Considerations

* Probabilities, EV and Alpha are less accurate for 0DTE and next day trades because the time component of the Black-Scholes model is too short
* Different position entry metrics (OTM %, spread width, max loss, max profit, etc) alter backtest results
* Each day the available position metrics are different and need to be retested
* Time of day alters available position metrics and changes backtest results

### How It Works

* Look up every available position from at-the-money (ATM) to 3% out-the-money (OTM) in 0.1% increments with each possible spread width ($5, $10, $15, $20, $25 for SPX and $0.50, $1, $2, $2.50, $5 for SPY, XSP and QQQ) from 9:31AM to 3:55PM EST
* Backtest the live position metrics currently available based on opening at that time of day and holding until expiration
* Legs are simulated at the same OTM % + spread width without rounding to test the current metrics consistently

This is different from backtesters based on a predetermined position entry strategy which test strike prices at varying OTM % and alternate premium and risk values available in the past - which produces completely different position metrics for each trade in the backtest.

We believe the metrics at the time of position entry (reward/risk, OTM %, spread width, max loss, max profit, etc) are THE most important part of getting into favorable trading opportunities so we decided to backtest the exact metrics available today against historical underlying price data instead of looking up completely different position metrics from the past.

Here is an example of backtest results for a 0DTE SPX Iron Butterfly opened at 12:26pm:

<figure><img src="https://2799944806-files.gitbook.io/~/files/v0/b/gitbook-x-prod.appspot.com/o/spaces%2F-MYjluAVRcRcfh1YL43z%2Fuploads%2FHin2JlWuMfc9CgU0P1tq%2Fimage.png?alt=media&#x26;token=14a88481-f545-47a1-a5e6-82c4f4548935" alt=""><figcaption></figcaption></figure>

#### Creating Custom Backtests

Custom backtests allow you to filter the days the backtest opens positions based on market conditions, underlying metrics, technical indicators, FOMC events and day of week.

For underlying metrics and technical indicators, the current value is displayed and you can specify a range to allow. For example, if RSI is currently 66 you can elect to allow a range of 60-90.

Here’s a screenshot of the custom backtest options:

<figure><img src="https://2799944806-files.gitbook.io/~/files/v0/b/gitbook-x-prod.appspot.com/o/spaces%2F-MYjluAVRcRcfh1YL43z%2Fuploads%2FdijmeRkKRcgKuKJIhQqY%2Fimage.png?alt=media&#x26;token=ebc5b135-afe0-40c4-948f-a85353582544" alt=""><figcaption></figcaption></figure>


# Earnings Edge

Earnings Edges gives traders a math-based approach to find backtested opportunities based on historical price action post-earning.

## Earnings Edge

Earnings announcements give us a cyclical opportunity to take advantage of inflated volatility. However, finding a trade with good mathematical metrics is challenging since probabilities, EV and alpha are not accurate across earnings reports.

The earnings backtester was created to help solve this problem and provide us with a way to make a calculated decision instead of guessing.

### Earnings backtesting overview

The earnings backtester analyzes the selected trade's metrics across the previous 5 years of earnings reports, using the out-the-money percentage of the position's strike prices (OTM%), the credit or debit, the spread width, and/or the max loss.

<figure><img src="https://2799944806-files.gitbook.io/~/files/v0/b/gitbook-x-prod.appspot.com/o/spaces%2F-MYjluAVRcRcfh1YL43z%2Fuploads%2FaF7bN0pUtMbu7qSxq9km%2Fimage.png?alt=media&#x26;token=36c00c9e-e9cf-4c28-ad52-ec40ac34d8b1" alt=""><figcaption></figcaption></figure>

The backtester simulates opening a position with the same metrics right before each earnings report and holding it until the next end-of-week (EOW) expiration.

Each position's backtest displays key data from the previous 20 earnings reports, including the win rate, average return, and best win.

<figure><img src="https://2799944806-files.gitbook.io/~/files/v0/b/gitbook-x-prod.appspot.com/o/spaces%2F-MYjluAVRcRcfh1YL43z%2Fuploads%2Fpuj8BMc7Bq3V9kcxr2ik%2Fimage.png?alt=media&#x26;token=804e226d-b0c0-4f0f-ad17-6fea6f19b094" alt=""><figcaption></figcaption></figure>

The P/L and ROR for each simulated position is calculated based on the symbol's closing price at the EOW expiration.

For example, if a short call spread with a strike price 3% OTM and a $1 spread width is selected, then the backtester will simulate opening a short call spread with a strike price 3% OTM and a $1 spread width across each of the earnings reports in the past 5 years with the same opening credit and max loss.

We can visualize the backtested earnings trades to see exactly how the selected strategy performed in the past, as well as the stock's price move post-earnings.<br>

<figure><img src="https://2799944806-files.gitbook.io/~/files/v0/b/gitbook-x-prod.appspot.com/o/spaces%2F-MYjluAVRcRcfh1YL43z%2Fuploads%2F2wfH7bWfMz1x3GfjYoGO%2Fimage.png?alt=media&#x26;token=e762aa7c-20e5-44b2-8697-c54360403b0d" alt=""><figcaption></figcaption></figure>

### Backtest any earnings trade

To backtest any trade that crosses an earnings report, select the position in the “New Position” screen and then click the “Backtest” button that appears in the top right.

<figure><img src="https://2799944806-files.gitbook.io/~/files/v0/b/gitbook-x-prod.appspot.com/o/spaces%2F-MYjluAVRcRcfh1YL43z%2Fuploads%2FS96O3arJZr8JZTHAiUGb%2Fimage.png?alt=media&#x26;token=2cc5a48f-b7ce-4bf8-8463-871518be8e56" alt=""><figcaption></figcaption></figure>


# Screener

Find, filter, sort and rank all supported symbols to find trades and create custom watchlists.

{% embed url="<https://vimeo.com/1052337984>" %}


# Trade Grid


# Top Strategies


# Backtesting

Backtest your ideas and automate your strategy to trade with the confidence of historical data.

### Backtest 0DTE and next-day options strategies

Run a backtest using multiple entry and exit criteria, position settings, and technical indicators to analyze detailed performance history for all your ideas.

### Compare and combine multiple backtests

Quickly add multiple variations to stress-test different variations and variables to improve performance. Then, combine the results of multiple strategies into one portfolio curve.

### Detailed logs of every trade for full transparency

Extensive logging gives you confidence in the backtest your running before going live with a strategy. Every backtest includes detailed trade logs in case you want to dive into historical data.

### Create a bot to automatically trade your new strategy

Once you've found a backtest you love, instantly turn that backtest into an automated bot that trades the exact same strategy you backtested. Then, let your new bot find and manage trades for you.


# Creating a backtest

Create your own custom backtest with specific settings and detailed entry/exit filters.

{% embed url="<https://vimeo.com/1052336755?fe=ec&fl=ls>" %}


# Comparing and combining backtests

Compare multiple backtests to optimize variations, assess the strategy's validity, and combine multiple tests into a single strategy.

{% embed url="<https://vimeo.com/1052338986?fe=ec&fl=ls>" %}


# Automate your strategy

Instantly create an automated strategy from any backtest to generate a bot complete with all the backtest's settings and filters.

{% embed url="<https://vimeo.com/1052336548?fe=ec&fl=ls>" %}


# Best practices

Understanding settlement for physically-settled securities and how it impacts backtest results.

## Backtesting Best Practices

{% embed url="<https://youtu.be/y4YmTEseOvo?si=v0ezc-pMTfyEVjB>\_" %}

### Why don't my bot trades match up exactly with the backtester?

* **A few seconds can matter** The backtester evaluates market data at the top of the minute requested in the position settings (e.g. an entry time scheduled for 10:00am EST looks at the underlying's price, option contract prices, strikes, etc at exactly 10:00am EST for each day in the backtest period). A live bot has to work through multiple decisions, select contracts, send the order, and receive a fill, which could result in small changes to the position's settings and/or pricing. In that time, prices may change slightly, sometimes in your favor and sometimes not.
* **Bid/ask prices fluctuate constantly** The backtester uses the position's mid-price at the time of entry. So, a backtest might simulate entering a position for a $12.40 credit, while the live market might experience a small but significant change in the bid/ask spread and pricing. Even a small price difference changes the position’s maximum profit, maximum loss, and eventual P/L.
* **Slippage settings** The backtester enables you to enter a slippage amount. Adding $0.10, for example, simply adds/subtracts $10 percontract from the backtested position's mid-price at entry and/or exit. However, the bot may fill at a different price (sometimes better than the slippage setting).
* **Live orders don't always fill** The backtest assumes entry based on the historical pricing available at that moment. A live bot must submit an order that another market participant is willing to fill. If the bot can't get its desired price, the position could fill at a different price—or not fill at all. Imagine an option is quoted $4.00 bid / $4.60 ask. There isn't one definitive "$4.30 price" at which you were guaranteed to trade. A historical assumption and a real order interacting with the market can produce different execution prices.
* **The exact contract selected can be different** If the strategy selects a .30 delta short put, the backtest may have found the 6,200 strike closest to .30 delta. In live trading, changing prices could make the 6,195 strike the closest match when the bot evaluates the position. The strategy rules are identical, but the actual position is different. For example, SPX underlying price changes multiple times per second. If you select $10 above the current price and it is on the edge, it could change the selected strike. And since SPX has minimum $5-wide strike intervals, that can shift the entire position up or down by at least $5.
* **Different entry prices can lead to different exit times** Say both positions have a 50% profit target. If the backtest enters a position for a $10.00 credit, its target is $5.00. If the live bot collects $9.50, its target is $4.75. One position might therefore close while the other remains open—even though both are following the same 50% profit-taking rule.
* **Scan time differences** The backtest scans one time and always fills if conditions are met. The bot is scanning a 15 minute window and has multiple opportunities to fill. That can create variance that can go (in your favor or against).
* **One small difference can create a chain reaction** This is especially important with a portfolio that has position limits or trade-frequency rules. If the backtest closes a position Tuesday but the live bot doesn't close it until Wednesday, the live bot might be unable to enter another Tuesday trade because it is still at its position limit. From there, the backtest and live portfolio can increasingly diverge.

#### The articles below were provided by Option Alpha Community member "[Robert DiNero](https://app.optionalpha.com/community/member/pachiraaquatica)" in [this post](https://app.optionalpha.com/community/all/post/i-wrote-the-occ-regarding-qqq-heres-wh-2025072818250) and [this post](https://optionalpha.com/community/posts/i-tried-the-spx-02-delta-iron-butterfl-2025112113443).

{% hint style="info" %}
For more information on pin risk and the differences of trading index options vs. equity options, with specific examples for a position expiring partially ITM and being assigned on the short leg as the long leg expires, you can review this article: [0DTE Partial ITM Assignment Pin Risk](https://optionalpha.com/learn/0dte-partial-in-the-money-assignment).
{% endhint %}

There have been several posts about QQQ expirations as well as the backtester. After spending a considerable amount of time reading I wrote a lengthy [comment back in May](https://app.optionalpha.com/community/all/post/flawed-qqq-0dte-paper-trade-result-2025050116395) in response to a post. Since this topic continues to come up, I thought I'd go to the source for clarification. For the most part, this confirmed my understanding of how QQQ settlement works.

#### Main points

* SPY/QQQ/IWM/GLD/TLT settlement time is stamped at 4:00 pm EST.
* SPY/QQQ/IWM/GLD/TLT trades until 4:15 pm EST even on expiration day.
* A long option holder can exercise their contract until 5:30 pm EST.
* If your short options are ITM at 4:00 pm EST they will be auto-assigned.
* If your long options are ITM at 4:00 pm EST they will be auto-exercised unless you file a contrary assignment notice.
* As the seller of an option contract, you collect the premium upfront to take on the obligation of that contract and keep that premium regardless of the expiration price.

#### How does this impact risk?

If you hold until expiration, then you have risk of [assignment](https://optionalpha.com/topics/options-settlement) even if it expires OTM (i.e. pin risk: see [my comment ](https://app.optionalpha.com/community/all/post/tos-iron-condor-resolution-procedures-202411257575)here). That risk exists regardless of whether options stop trading at 4pm or 4:15pm since long contract holders can exercise options **until 5:30**. If QQQ were to close OTM but QQQ moves past your short strikes after-hours, then **you will not know** whether you will be assigned until the next morning leaving you open to unmitigated risk.

If you were assigned on a short call, then you would be short 100 shares for every contract assigned, which in turn means that a $1 move up will reduce your profits by $100 per contract (i.e. 200 contracts with a $3 move up is a -600 loss). That loss can be **greater** than the max loss defined by the spread since you no longer have the long option contract as protection (unless you call your broker and exercise it, which is a whole other discussion).

Another risk is that your broker closes the position before 4:15pm. They may submit an order that is not in your favor in order to reduce their risk, which could result in a loss greater than the max risk you thought you had. In addition, this would count as a daytrade.

#### Will Option Alpha know whether I'm assigned or whether my broker sold the position?

OA will not receive data via the API regarding the assignment or the sold position. This means that you could have shares of stock that have been affected by overnight moves. It also means that your account may be assigned positions you either do not have enough buying power for, or aren't approved to hold (i.e. short shares). This in turn means that you could have a margin call and be unable to open positions until the margin call is resolved.

It also means that you will need to edit your closing order in OA to reflect the gain or loss on assignment/sale. Kirk has a video on [how to handle assignments in OA](https://app.optionalpha.com/community/all/post/kirk-posted-new-video-thu-1221-short-p-2023122213105). (Kirk has a [bolt on early options assignment risk automation](https://app.optionalpha.com/community/member/kirk/post/early-options-assignment-risk-manageme-2025050812380) that can help with early assignment risk. See also posts [here](https://app.optionalpha.com/community/all/post/handling-an-assignment-with-tradier-2023092113342) and [here](https://app.optionalpha.com/community/all/post/mitigating-risk-of-early-assignment-2023052414244)).

#### How does this impact the backtester and results?

In my opinion, it doesn't. No backtester can determine whether a long contract holder will exercise their rights after 4pm. Only a subset of long contract holders will exercise their rights and even then the OCC will randomly assign the contract to a broker, who will randomly assign it to a contract holder.

**Then are the closing prices of the backtester wrong for ETFs?**

The PL shown in the backtester is correct in the sense that it reflects the price at 4pm, which is when the QQQ settlement time is stamped and when the bots stop running. However, you have a significant risk of assignment that cannot be accounted for in the backtester, which in turn affects your own specific results and how you individually may handle the assignments.

For example, at 4pm the position either expires ITM or OTM. If it closes OTM, then the PL correctly reflects premium received. However, **you could still be assigned** and end up with a different gain/loss if the underlying price (not the contract price) moves against you. If it closes ITM, then the PL shows what would be the cash settled price. If it closes ITM between the short and long strikes then you would be assigned and you could end up *better off or worse off* depending on whether QQQ moves in your favor overnight. If it closes ITM beyond your long strike, then you would most likely end up with your max loss at expiration. However, you could still end up buying 100s of shares of QQQ if enough long holders file contrary assignment notices (now I imagine this would be extraordinarily rare, but it is still a risk nonetheless especially if QQQ falls overnight).

It's possible that OA could calculate the gain or loss based off of selling your assigned QQQ position the next day at 9:35am, but that assumes that you must close your position at that time. However, you might close your position at 7am or 8am. Or you might hold the assigned stock. Or you might exercise your longs as Otto notes on[ this thread](https://app.optionalpha.com/community/all/post/flawed-qqq-0dte-paper-trade-result-2025050116395). Or maybe you buy the underlying at 7:45pm. As you can see, there are several ways to handle an after-hours move that the backtester and bots cannot account for.

#### Final thoughts

If you are holding QQQ to expiration (or any physically-settled contract) then you need to know **exactly what the risks are**. The backtester is an important tool in assessing whether your strategy has any merit, but the backtester cannot account for risk of assignment. You should use the data the backtester provides as a starting point, not an ending point. In other words, once you've run your backtest, review the expired positions to determine whether you'd be assigned.

Or better yet, consider closing physically-settled tickers before expiration and use cash-settled tickers for holding through expiration.

Please let me know if you have questions or if anything I said needs to be clarified or corrected.

### Validating unrealistic strategy backtest results

Many backtests can look good on paper but, in reality, have no realistic chance of working in a live market environment. Ultimately, it is always up to us as traders to apply critical thinking skills when analyzing backtet results and assessing a strategy's validity.&#x20;

Backtesting and paper trading operate under the assumption of an order being filled, either at or near the mid price or using whatever slippage settings you may have. In a live market, there is no guarantee an order will fill, and no objective way to accurately model what may or may not happen live, so it is the trader's responsibility to assess the backtest settings and analyze the potential validity.

The most common unrealistic backtest is the far out-of-the-money iron butterfly, and similar strategies that essentially rely on capitalizing on erratic bid/ask spread fluctuations. See Robert's post [here](https://optionalpha.com/community/posts/i-tried-the-spx-02-delta-iron-butterfl-2025112113443) for a great breakdown. Here is a visual image of the strategy in question:

<figure><img src="/files/Mb0oMtxOW8JxtdGgJc0r" alt=""><figcaption></figcaption></figure>

This video guides you through validating backtest results:

{% embed url="<https://vimeo.com/1052338986>" %}

This video highlights key considerations for taking a strategy live:

{% embed url="<https://youtu.be/BZYGVz6vJNE?si=awJzPcUDnrskXK_o>" %}


# Backtesting Metrics

Overview of how the autotrading backtest engine operates and what each of the different performance metrics mean.

The [Backtester](https://optionalpha.com/backtester) is a tool designed to backtest 0DTE and next-day options strategies by leveraging 1-minute historical data to find an edge and then quickly automate the strategy by generating a bot. Traders can use a test period of up to three years, and compare up to four backtests simultaneously, and combine multiple backtested strategies to see a single portfolio P/L curve.

#### Stats

Click here for more details on [performance metrics](https://optionalpha.com/learn/performance-metrics).

* Total P/L - Overall profit or loss in dollars.
* High P/L - Highest profit or loss recorded in the testing period.
* Low P/L - Lowest profit or loss recorded in the testing period.
* Max Risk - Maximum capital at risk at any point during the test (Losing P/L + open position risk).
* Max Drawdown - Largest fall from P/L peak-to-trough.
* ‍[Profit Factor](https://optionalpha.com/learn/profit-factor) - The profit factor divides the total amount of money gained by the total amount lost. The profit factor is important when used with the win rate because it creates a complete view of trading performance.&#x20;

#### Positions

* Count - Total number of positions included in the backtest
* Win Rate - Total number of winning trades by total trades.
* Best Win - Trade with the highest profit in the backtested period.
* Worst Loss - Trade with the largest loss in the backtested period.
* Win Streak - Most consecutive winning trades.
* Loss Streak - Most consecutive losing trades.
* Max Profit % - the % of positions that won the max profit.**‍**
* **‍**Max Loss % - the % of positions that lost the max profit.

#### Averages

Backtest stat averages are calculated on a per-trade basis by summing the value of the metric and dividing by the total number of trades included in the test. For example, if 500 positions were included in the backtest, and the total P/L was $2,000, the average P/L would be $4.

#### Filtered Trades

View all filtered not included in the backtest because they did not pass an entry filter or position criteria.

#### Entry time

The backtester uses specific entry times to simulate trade history. Traders can select from 5-minute increments or set a custom time between 9:35 am EST and 3:55 pm EST.

#### Entry filters

Change % is calculated from the previous close to the backtest entry time. For example, if running a 0DTE backtest with an 11:00am entry time, change % will reference the underlying price at 11:00am each day relative to the previous close value.


# Top backtests


# Managing Positions

Let bots monitor your trades with instant exit options.


# Exit Options

Exit Options automatically manage your positions every minute of the day so you don't have to worry about tracking your trades' profit, loss, days to expiration, or earnings.

## Exit Options

Exit Options enable us to pre-set exit criteria, so bots can manage our positions automatically throughout the day. Plus, orders are only sent to the broker when your criteria is met, so you no longer need to worry about having resting orders exploited while sitting in an order book (say goodbye to stop-hunting market makers).

{% embed url="<https://vimeo.com/1114281456>" %}

#### 1-minute auto position management

Exit Options check your position every minute and send a closing order if your exit criteria are met.

#### Instant Exit Options

Live bots can enable Instant Exit Options, which continuously monitor and update position returns and respond to changes in the leg and underlying pricing.

#### Scheduling Exit Options

Exit Options can run from 9:31 am ET until 1 minute before the market close. You can customize the Exit Options schedule in your [Settings](https://app.optionalpha.com/settings#schedule).

<figure><img src="https://2799944806-files.gitbook.io/~/files/v0/b/gitbook-x-prod.appspot.com/o/spaces%2F-MYjluAVRcRcfh1YL43z%2Fuploads%2FTr8KCpksMb6xvP6BSPO6%2Fimage.png?alt=media&#x26;token=e8c71dc9-b58a-4b0d-860b-229daa4c7d1b" alt=""><figcaption></figcaption></figure>

Exit Options always run, even if your automations inside a bot are turned off, so your positions are always managed, unless you turn off Exit Options in your bot (see below).

Exit Options use a position's mid-price when evaluating returns. (**Note**: you can use a [bid-ask guard](https://optionalpha.com/workshops/trailing-stops) to disable Exit Options from closing a position or tracking the high % or low % of the position if the bid-ask spread is wide).

#### Exit Option Management Criteria

You can customize each position's Exit Options for specific management using six triggers:

* Profit Taking
* [Profit Target](https://app.optionalpha.com/community/updates/post/opening-range-breakout-profit-target-e-2025061610005)
* [Price Target](https://app.optionalpha.com/community/updates/post/opening-range-breakout-profit-target-e-2025061610005)
* Stop Loss[‍](https://optionalpha.com/blog/trailing-stop-exit-options)
* [Trailing Stop](https://optionalpha.com/blog/trailing-stop-exit-options)[‍](https://optionalpha.com/blog/new-exit-option-for-itm-price-touches)
* [Touch](https://optionalpha.com/blog/new-exit-option-for-itm-price-touches)‍
* Expiration
* Earnings

<figure><img src="https://2799944806-files.gitbook.io/~/files/v0/b/gitbook-x-prod.appspot.com/o/spaces%2F-MYjluAVRcRcfh1YL43z%2Fuploads%2FxJBDq8VYqYJMWN2MfoYL%2Fimage.png?alt=media&#x26;token=76c99408-e3d5-4da1-b498-6499a8b5b486" alt=""><figcaption></figcaption></figure>

> **Note:** There is no guarantee that an order will fill in a live market. It is possible that a position won't close when an order is sent to your broker for execution. Markets move fast, and bid-ask spreads can be volatile. Orders triggered by an exit option will remain active for two minutes; during that time, no additional orders will be sent to your broker. If the order is not filled, exit options will resume checking the position at the next 1-minute interval. When using the 'Expiration' setting, the bot will continue sending orders for the remainder of the trading day if the order does not fill at the specified time.
>
> Also note that there is no guranatee that a stop loss or trailing stop value will be the exact closing value. A closing order is triggered when the position's mid-price is at or beyond the stop loss value, but it is possible that the realized loss will exceed the expected value.

#### Exit Option closing orders

You can use [SmartPricing](https://optionalpha.com/help/smartpricing) when closing a position, turn off SmartPricing, or use a market order.

Exit Option orders are automatically canceled after two minutes. If an order is not filled, Exit Options will check your position at the next interval and, if necessary, re-start the process of sending orders to your broker if the exit criteria are still met.

{% hint style="info" %}
Profit Taking Exit Options are a special scenario. Profit-taking Exit Options set the final price to your profit-taking level to ensure your minimum profit target is received if the order fills. You don't need to set a "Final Price" because the final price is automatically set by the bot to a price that locks in the profit you specified. It won't try a worse price that would result in profit less than your specified amount.
{% endhint %}

The Before Expiration and Before Earnings triggers operate based on calendar days in the same way 'days to expiration' is calculated and will execute at 3:29 pm ET if using a day-based selection. For example, if today is Friday, a position expiring on Monday is considered 3DTE. When using an exit trigger for Before Expiration or Before Earnings, it's the traders responsibility to be aware of how weekends and market holidays will affect the contract's days to expiration value.\
\
If you check the PDT box, the bot will wait at least one day to close a position to avoid [pattern day trading](https://optionalpha.com/learn/day-trading-rules).

We can also use the [bid/ask guard](https://optionalpha.com/blog/expanded-smartpricing-settings-control-slippage) to protect from temporary price fluctuations. You set the maximum width of the position's bid/ask spread you are comfortable with, and if the position exceeds this value, it will disable Exit Options from closing a position or tracking the high % or low % of the position until the bid/ask spread is below your setting.

[Save your Exit Option criteria as a Preset](https://optionalpha.com/blog/exit-options-presets) to be reused for similar position types. You can name your presets for easy identification. All Exit Options will automatically populate when you use a Preset.

#### Using Exit Options

You can set your Exit Options for any trade when opening positions manually or in an automation's Open Position action. When using Exit Options in an Open Position action, all positions opened in the automation will have the same entry criteria. Once opened, Exit Options are specific to each position. You can always edit each position's Exit Options at any time after it is opened.

Additionally, you can enable and disable Exit Options from the main Bots page, inside of the bot as shown below, or individually within each position.

<figure><img src="https://cdn.prod.website-files.com/5fba23eb8789c3c7fcfb5f31/66c89d06f0d19a8e0191ba88_66c89c8b1a28b9803f225de3_automation-toggles.png" alt=""><figcaption></figcaption></figure>

#### Using Automations to Update Exit Options

Update Exit Options inside an automation for added flexibility and complete control, all while still enjoying 1-minute automated position management.

This video demonstrates how to use automation actions to set (and re-set) Exit Options whenever and however you want. Modify profit targets and stops for different market conditions, position returns, days in trade, days until expiration, market events, and much more.


# Monitor Automations

Use a monitor automation to your bot that checks for more specific exit conditions:

{% embed url="<https://vimeo.com/1052337292>" %}


# Automated Trading

Leverage automation to improve returns, find better trades, and transform into a superhuman trader.


# Clone Bot Templates

With bot templates and bot cloning, you can easily find ideas, share trading strategies, and add bots to your portfolio with a single click. Finding new trading strategies has never been easier.

One of the most powerful features supporting the process of discovering, sharing, and implementing trading strategies is the use of bot templates and cloning. These tools allow you to easily replicate successful strategies, collaborate with other traders, and expand your trading portfolio with minimal effort.

{% embed url="<https://vimeo.com/1128218958>" %}

#### **Cloning: Quickly Add Bots to Your Portfolio**

Option Alpha makes it easy to clone bots directly from templates or from other bots. With a single click, you can add a cloned bot to your portfolio, complete with all the settings and strategies of the original bot. This functionality allows you to quickly and efficiently expand your portfolio of bots and build variations of one bot or another.

#### **Creating and Using Templates**

Any bot you create on Option Alpha can be saved as a template. This feature allows you to store your strategies indefinitely, making it easy to revisit and reuse them as needed. Whether you’ve developed a unique trading approach or simply want to keep a record of a successful bot setup, saving it as a template ensures that your hard work is preserved.

#### **Sharing Templates: Public vs. Private**

Templates offer flexibility not just in how you use them, but also in how you share them. You have the option to:

* **Share Publicly**: If you choose to share your template with the community, other traders can view, clone, and implement your strategy. This collaborative approach fosters a dynamic environment where traders can learn from each other and experiment with new ideas.
* **Keep Private**: Alternatively, you can keep your templates private, stored securely in your personal library. This option is perfect if you want to maintain control over your strategies or use them exclusively within your own portfolio.

#### **The Community and Public Templates**

Within this community, you’ll find a wide variety of templates created by other traders. These public templates offer valuable insights into different trading approaches and can be a great resource for finding new ideas to incorporate into your own bots.

In addition to community-shared templates, members of the Option Alpha team also contribute public templates. These templates are typically educational in nature, representing experimental ideas or collaborations that invite feedback and participation from the broader trading community. It’s important to note that while these templates can be highly informative, they are often intended for educational purposes and should be forward-tested thoroughly before being applied to live accounts.

#### **The Leaderboard: Tracking Template Performance**

For those interested in seeing how different templates perform, the community features a leaderboard that ranks publicly shared templates based on their performance in both paper trading and live accounts. The '[Top Bot Template](https://app.optionalpha.com/community/toptpls)' leaderboard is a valuable tool for identifying successful strategies and gaining insights into what’s working in real trading environments. By exploring top-performing templates, you can find inspiration and ideas to enhance your own trading activities.

Templates and cloning on Option Alpha provide a powerful way to streamline your trading activities, whether you’re looking to develop new strategies, collaborate with others, or simply expand your portfolio.

By taking advantage of the platform’s template features, you can easily save, share, and replicate successful bots, ensuring that your trading strategies are always at your fingertips. Explore the community, experiment with public templates, and use the leaderboard to guide your decisions—trading has never been more accessible or collaborative.

<figure><img src="https://2799944806-files.gitbook.io/~/files/v0/b/gitbook-x-prod.appspot.com/o/spaces%2F-MYjluAVRcRcfh1YL43z%2Fuploads%2FbmXdlRCu2TCFLPL6XBFt%2FTop%20Bot%20Templates.png?alt=media&#x26;token=00c5a187-43d7-44cb-8096-79f78f8c7214" alt=""><figcaption></figcaption></figure>


# Manual Trading


# Automation


# Platform


# Infrastructure & Security

A detailed overview of the server and network infrastructure used to run the autotrading platform.

The Option Alpha bot ecosystem is hosted entirely on Amazon Web Services (AWS), located within the United States. The front-end is written primarily in native JavaScript, with minimal reliance on third-party frameworks. The back-end infrastructure is written entirely in Node.js and deployed across a large, distributed network of servers.

We are proud to say that all of our servers are the fastest available anywhere in the cloud. Each Linux server runs an all-core turbo clock at 4.5 GHz to ensure automations and data are processed as fast as possible.

Bots are stateful and in the unlikely event of a network failure, the entire system can be brought back online in a matter of seconds, resuming the exact state they were in prior to failure.

## Pod System

The entire platform is set up to auto-scale as new users join. We use a horizontal scaling paradigm, meaning that each user is allocated resources per bot service instance, with a predefined number of instances per server, across *n* servers. Each server is referred to as a *pod*, where each pod can handle *m* users.

The entire network of pod servers is closely monitored for resource usage, and at any time we can re-scale the total number of users per bot service instance, instances per pod, and/or total pods to maintain network stability.

## Browser Compatibility

The autotrading platform offers cutting-edge technology directly inside your web browser. There is no software to download. The trade-off is browser compatibility.

Not all browsers are compatible with the platform. To provide users a consistently fast and extremely powerful web-based software, our developers leverage advanced features available to Google's [V8 engine](https://v8.dev/) that runs JavaScript.

An engine is underlying code that's used to interpret and execute Option Alpha's JavaScript instructions at the browser level.

Therefore, the officially supported browser is [Google Chrome](https://www.google.com/chrome/). In theory, any browser running V8 (the new Chromium-based Microsoft Edge, for example), should be fully compatible.

**Users not running Google Chrome or another V8 browser will experience stability issues.**

Any user not running a V8-compatible browser will still be able to login to the platform but may experience undocumented stability issues. The user may not even be aware the application is not functioning as intended.

## Security

Most platforms are a collection of code from various libraries and scripts that creates an unstable platform and leaves you vulnerable. Instead, we spent five years building the entire platform and network from the ground up with an in-house team of developers.

We wrote every single line of code that runs automated trading which means we control the full software stack from top to bottom. There is an absolute minimal reliance on third-party packages or software.

You won't find this level of commitment anywhere else. Plus, we also...

1. Operate a web-based platform in the cloud, hosted by AWS and monitored by our team inside our Virtual Private Cloud (VPC).
2. Require the highest level of TLS browser encryption.
3. Send all requests originating from bots via point-to-point access from our US-based servers directly to your broker.
4. Place multi-tiered web application firewalls (WAFs), in front of all web traffic, to protect against malicious hacking or denial-of-service (DoS) attempts.
5. Use reverse proxying to scalable web server instances to create the fastest platform possible for our traders and ensure uptime.

## Broker Connections

The method the bots use to connect to your brokerage account is dictated by the broker. In most cases, they will dictate the use of the [OAuth 2.0](https://oauth.net/2/) standard for access delegation.

When it is time to [connect to your broker](https://optionalpha.com/help/trading-accounts) for live trading, we will present you with a secure login modal for your account to authenticate the bot server with your broker. The broker will provide us with a special token that the bots will use in a very limited capacity.

{% hint style="info" %}
Bots only use broker connections to submit or monitor active orders and positions. They only access your broker when required. Option Alpha does not have access to your account details.
{% endhint %}

Bots are not constantly connected to brokerage accounts. Instead, they only submit orders through the API and monitor their status, if required. All tracking that occurs during the lifetime of an open position is done directly through the bots and their live data feed.


# Automations

An automation is conditional logic, represented as a decision tree scheduled to run at a particular time.

## Automations

### Global Controls <a href="#global-controls" id="global-controls"></a>

Automations adhere to the Bot Settings' strict global controls when opening a new position. There are 3 primary controls:

| Control              | Description                                                                     |
| -------------------- | ------------------------------------------------------------------------------- |
| Allocation           | Total capital from your trading account available for the bot to open positions |
| Daily Position Limit | Number of positions that can be opened by the bot in one day.                   |
| Max Position Limit   | Number of positions that can be open at any given time.                         |

Before sending an order to your broker, the bot first checks if it is within the bounds of its global limits. If opening a new position violates any of these limits, the bot will alert you with an error.

These conditions are checked before the bot works through an automation. If the conditions are satisfied, the bot will continue through the automation and follow your actions.

#### Binary Trees

Decision trees are modeled after one of the most fundamental structures in computer science: binary trees. Mathematically, a binary tree is a connected, undirected, finite graph with no cycles and no vertex of degree greater than three.

For most computer science applications, as in the case of the autotrading bots, binary trees are rooted. A special nod&#x65;*, r*, of degree at most two is called the root of the tree. For every node *u* ≠ *r* the second node on the path from *u* to *r* is called the parent of *u*. Each of the other nodes adjacent to *u* is called a child of *u*.

Most binary trees we are interested in are ordered, so we distinguish between the left child and right child of *u*, i.e., the Yes/No decision path.

Binary trees are typically drawn from the root downward, with the root at the top of the drawing and the left and right children respectively given by left (Yes) and right (No) positions in the drawing.

**Nodes**

Each parent and/or root node of the decision tree is composed of conditional statements, using both logical and relational operators, built out of "decision recipes" curated by the Option Alpha team.

[Grouped conditional statements](https://optionalpha.com/blog/grouping-and-nesting-decisions-for-more-powerful-automations) work in the same way they would in any modern programming language, discrete math and/or discrete logic, with the exception that decisions in automations do not use negation.

<figure><img src="https://cdn.prod.website-files.com/5fba23eb8789c3c7fcfb5f31/6232099a393d897547645cc2_Nodes%20(tech%20docs).png" alt=""><figcaption></figcaption></figure>

If a leaf node in a decision tree results in an action to open or close a position, the bot will use your broker's API to submit the order.

Input parameters first undergo a translation process; for example, the rate of return in “Opportunity rate of return is greater than 25%” is translated into a real number before the mathematical condition is tested.

The translation process into mathematical properties requires the user to input theoretical trade criteria, and that trade criteria has parameters of its own. In this case, the parameter input process is multiple layers deep. Fortunately, these trade inputs are identical to the opening position parameters required for the action of placing a real trade, typically located at the bottommost node of the decision tree.

All parameters are evaluated for a binary outcome (true or false). In general, all numeric parameters are used to test a conditional statement for truthfulness. The conditions are described with natural language that represents a mathematical operation, e.g., above or below implies greater than (>) or less than (<) in “MSFT price is above/below 100.”

The decision tree “decisions” and their parameters are grouped into four main categories: stock-based, opportunity-based, indicator-based, and position-based.

**Negation**

Decision nodes can also be [negated by adding a NOT property](https://optionalpha.com/blog/edit-automation-paths-with-negated-decisions) in front of the decision logic. This allows the user to negate particular logic and more easily force the flow of a binary tree down the No path.

<figure><img src="https://cdn.prod.website-files.com/5fba23eb8789c3c7fcfb5f31/6234993099bc9efe6c1be473_Negation%20Tech%20Docs.png" alt=""><figcaption></figcaption></figure>

#### Automation Types

**Scanners & Monitors**

[Scanner and Monitor automation](https://optionalpha.com/help/automation-basics) categories are simply logical groupings for the abstract automation type. Automations in the Scanner category are intended for the searching and opening of opportunities, while automations in the Monitor category are intended for the management and closing of open positions.

There is no functional difference between the automations in either category. If required by the user, a Scanner automation can close a position or a Monitor automation can open one. In this sense, the Scanner/Monitor categorization is a convenience.

Scanners will not run once a [position limit](https://optionalpha.com/docs/troubleshooting) is met. However, when using a monitor to open a position, if that position violates the global position limit settings, an error safeguard is in place and will throw an error for violating the set limit.

{% hint style="info" %}
Scanners are designed to be used as the primary automation to open positions because of their strict adherence to the position limit settings.
{% endhint %}

**Events**

Events offer more control over automation execution than generic intervals. Users can create events to fire on a specific date, at a specific time, at this very moment, when something happens inside the bot, and everything in between.

{% hint style="info" %}
Events are established and executed in Eastern Time. When creating events, you are creating the event based on Eastern Time which may cause a difference in current or next-day interpretation from your browser's time zone.
{% endhint %}

**Scheduled**

[Scheduled events](https://optionalpha.com/help/automation-scheduling) are automations that run on a schedule, either once or in a repeating fashion. Users can choose to schedule one highly specific event, such as May 12th, 2021 at 9:45 AM Eastern, or on an arbitrary repeating schedule - e.g., the first of every month, every Mon/Wed/Fri, every third Friday, etc.

Holidays are accounted for in scheduled events. A user will have the option to run an automation the day before a holiday, the day after a holiday, or skip the holiday altogether. Selection can be made on the "Schedule" tab of an automation event.

{% hint style="info" %}
A UTC offset is employed for all Scheduled events. This means that when creating an automation to run 'next day' you must be before UTC 00:00 in order for the event to run the next market day. For example: 7:00pm EST or 8:00pm EDT.
{% endhint %}

**Unscheduled**

There are 2 types of unscheduled events: resultant events and button clicks. Resultant events will fire as a result of another event occurring, such as the Opening or Closing of a position. When any position of a particular type is opened or closed, the user can choose to execute a separate automation immediately afterward.

Button clicks events are fired as a result of pressing a button the user adds to his or her dashboard. One button click results in one execution of an automation. These can be executed at any time during open market opens.

<br>


# Automation Behavior

Curious how automations work? This is a technical overview of the autotrading platform's automation behavior and execution configuration.

## Automation Behavior

### Synchronous Execution

Automations execute in an adjustable synchronous order, meaning automations run in the order specified by the user. Automations following in sequence will not wait for order completion but rather will wait for a callback and proceed to the next automation. This means 5 scanners with 2-minute limit order will not hold up execution.

The order is configured by selecting the arrows to the right of an automation. The automation on top runs first and the bottom automation runs last.

<figure><img src="https://2799944806-files.gitbook.io/~/files/v0/b/gitbook-x-prod.appspot.com/o/spaces%2F-MYjluAVRcRcfh1YL43z%2Fuploads%2FsAKKFQcFeuBLFuz4bGiq%2F66d72ca07b613eae55db74f2_63e3cfbf7579512dc8525024_Automation%2520Ordering.png?alt=media&#x26;token=912065c9-6dd7-4c17-a22e-d8dc5798bdd1" alt=""><figcaption></figcaption></figure>

It is important to note that [monitor automations](https://optionalpha.com/help/automation-basics) will run first to process any closing orders ahead of possible new opening orders from a scanner. This is designed to alleviate concurrency issues when opening and closing positions on the same scan interval.

> Scanner and monitor automations are queued and processed synchronously. Execution order is never guaranteed.

A redundant position check occurs prior to each execution. In the event Scanner 2 opens a position prior to Scanner 1, and has reached a global [position limit](https://optionalpha.com/help/safeguards), a warning will alert the user that the maximum position count has been reached.

This can happen when Scanner 1 has an execution method that is slower than Scanner 2, and Scanner 2 fills an order prior to Scanner 1.

<figure><img src="https://2799944806-files.gitbook.io/~/files/v0/b/gitbook-x-prod.appspot.com/o/spaces%2F-MYjluAVRcRcfh1YL43z%2Fuploads%2FOvqyiT28ePMPSxHQANtN%2F66d72ca07b613eae55db74ef_62320a0a2b1bdbb2685633b3_spaces252Fuploads252Fredundant2520check.png?alt=media&#x26;token=d99d84a9-ac4f-4870-a754-dcd2a81e2f2d" alt=""><figcaption></figcaption></figure>

{% hint style="info" %}
The overall order of automations are: Exit Options, Scheduled Events, Monitors and Scanners.
{% endhint %}

### Loops

The platform employs two different loop types -- [Position](https://optionalpha.com/help/loops) and [Symbol](https://optionalpha.com/help/loops). Loops give you the ability to cycle through, or loop, a group of positions or symbols to check for other logic conditions down your decision tree.

Although scanner automation groups and monitor automation groups operate in a synchronous manner, loops inside them do not, and modifying this behavior would result in excessively long execution time. When a loop executes, the full logic of the decision tree is run for each symbol sequentially one after another.

When looping through Positions, the processing order is always Oldest to Newest. However, be aware that we reserve the right to change the way the cache system works and the behavior of how it returns the list of positions.

### Position Allocation & Loops

When using a multi-symbol loop with a percentage-based allocation for each trade, it is not guaranteed that the % of available capital is distributed in the same order as the symbols inside of the loop.

Capital use is done by first figuring out how much there is total, then how much can be used based on the desired per position amount, and finally how many contracts/shares can fit into that amount based on margin requirements.

**Example:** Using $10k Total Allocation, 45% Net Liquid per position, with SPY, QQQ, and TLT in a Symbol Loop.

If you run the SPY, QQQ, TLT example test 100 times in a test environment, it will almost certainly use 45% SPY, 45% QQQ, and \~10% TLT, 100 times out of 100, because that's the order in which they're initially called and no one is competing for processor time.

But the moment you run the same loop in an active environment with hundreds of other bots executed by the same process, and at the same time pulling and waiting on all kinds of asynchronous data (e.g., opportunity decisions, indicators, etc.) from other processes, there is no guarantee which symbol will end up with the \~10%.

This means whichever symbol makes it to the order book first will get first dibs on decrementing the capital pool for itself. Nothing is based on fill or execution because that hasn't happened yet. The only certainty is whoever gets to the capital pool first and begins the process of opening a position gets to synchronously decrement the pool first with its pending draw value.

That is how we ensure the bot stays under $10k at all times. Poorly constructed logic will have the potential to yield unexpected results and it is encouraged to utilize other decisions to avoid common errors and warnings when utilizing loops.

{% hint style="info" %}
If you attempt to open multiple positions using a percentage-based allocation amount greater than 50%, the subsequent position contract or share amount will be reduced intentionally to avoid an overallocation of more than 100% of bot capital.
{% endhint %}

### 1-Minute Exit Options

Any position can be assigned [1-minute Exit Options](https://optionalpha.com/help/exit-options) through an automation's Open Position action, its Update Position Exit Options action or the Manual Trading interface. The user-defined parameters are checked every one market minute between 9:40 AM and 3:59 PM Eastern. Safeguards have been established to ensure that your profit or stop loss levels are set to the worst possible fill based on the direction of the spread at the point the order is initiated (e.g., the bid price if selling or the ask price if buying). This can result in an order being canceled if unfilled but ensures that high exit efficiency is maintained.

The default exit method for Exit Options is SmartPricing set to normal and 100% of the Bid/Ask spread. It is possible that your exit fill may be within a 1% tolerance of your specified stop or target value because of the ask price's value at the point SmartPricing begins. Additionally, because SmartPricing will begin near the bid price, for example, exits can be higher than your specified target when trading a liquid underlying and contract.

{% hint style="info" %}
In high volatility times it is possible the price of an option contract can change rapidly and surpass your Stop level.
{% endhint %}

Bots will actively prevent an action from taking place when an identical action is already in process to avoid overlapping with other automations. The event sequence is set to run Exit Options before other automations in the following order: Exit Options, Scheduled Events, Monitors, and Scanners

### Intervals

Every Scanner and Monitor has a default scanning interval of 15 minutes. This means every 15 minutes—beginning approximately 15 minutes after the market opens, and ending at 15 minutes before the market close—automation(s) will scan for the criteria specified in the automation. If criteria are met, your bot will take an action, whether that is to open a trade, close a trade, or prompt you to take further action.

{% hint style="info" %}
You can also self-select 5-minute and 1-minute scans. Scan speeds are set at the bot-level; each bot defaults to 15 minutes unless you select a different speed.
{% endhint %}

All user automations are pushed into a distributed work queue and executed in parallel by worker processes. There is no guarantee an automation will run exactly on the 15-minute marks of every hour.

If a price, indicator, etc. exceeds a threshold between intervals, the bot does not know about it. The one major exception is tracking Smart Stops, where the position gain and high gain are tracked every minute. Regardless, even if a bot is logging information or position data between intervals, it will not act upon it until automation execution at the next interval.

In *most* cases, a bot will pull fresh data for all relevant decisions in every automation during execution. In other words, every 15 minutes, all relevant securities or options symbols will be quoted with the most up-to-date (usually sub-second) data.

### Expiration Day

The last bot automation interval takes place at 3:45 Eastern time (15 minutes before market close). You can also use an automation trigger to run 10 minutes before the close. If it is [expiration day](https://optionalpha.com/help/order-handling) and any leg of an options position is in-the-money (ITM), the bots will attempt to close the entire position. Bots do not support assignment and are unaware of assignment, which can still occur for out-of-the-money positions before or after the market closes..


# Data Feeds

An overview of the platform's data operations, ticker selection process, and a current database of tradable symbols.

{% hint style="info" %}
[Click here](/technical-documentation/platform/supported-ticker-symbols) to see the full list of supported ticker symbols.
{% endhint %}

## Data Feeds

Option Alpha streams real-time consolidated equity and options data. Our data feeds feature a 99.98% uptime and are relied upon by some of the world's leading financial institutions.

Consolidated stock market data is an aggregated reporting of all securities exchanges’ and alternative trading venues’ price and volume data. It is the most relied upon type of market data, providing investors and traders globally with a unified view of U.S. stock market prices and volumes.

It also underpins the National Best Bid and Offer (NBBO), which provides investors with a continuous view of the best available displayed buy and sell prices, and through Rule 611 ensures that investors receive the best available displayed prices on their trades, with a few exceptions.

Consolidated reporting has been standardized since the 1970s when Congress directed the Securities and Exchange Commission (“the SEC”) to establish a “National Market System” for securities trading.

Specifically, data collection, aggregation, and distribution are formalized in the Consolidated Tape Association (CTA) Plan and the Unlisted Trading Privileges (UTP) Plan. These plans are administered by the Consolidated Tape Association and UTP Plan market participants, and they dictate that each exchange is required to send its trade and quote information to the Securities Information Processor, also known as the SIP (of which there are two, one for Tape A/B and one for Tape C).

The entire bot ecosystem operates on real-time CTA/UTP data streamed constantly throughout the trading day.

{% hint style="info" %}
Did you know? The bots are tracking over 150k options contracts per day. Each is updated (at most) every 500ms. That's 300k updates per second, 18 million updates per minute.
{% endhint %}

#### How it Works

Option Alpha uses a consolidated CTA/UTP data feed, aggregated from all major exchanges. All option symbols being tracked are NBBO, streamed in real-time, with a max update rate of 500ms (milliseconds). Each symbol, equity or option, is updated at most every 500ms unless the symbol received no updates within that time span (think thinly traded, far out-of-money options).

Bot data is aggregated via data capture every time an automation runs. The bot is capturing data at a specific millisecond in time, whereas your broker platform is updating continuously. Therefore, unless you see your broker data at the exact millisecond of the bot data, there is likely to be a mismatch.

Furthermore, many brokers have proprietary calculations for some indicators, etc. to "simulate" specific readings during the course of a day. While we may have similar indicators, the calculations may be slightly different.

**Real-Time Data**

With the exception of the cached values discussed below, all data is streamed constantly to our market data server. These values include pricing information like bid/ask, volume, open interest, greeks, etc. When an automation is executed, either at a scheduled interval or on-demand, the bots will request the most up-to-date values the market server knows about at that moment, down to the millisecond.

This data is then used inside of every bot decision or action during that run.

**Data Caching**

Some unchanging data values are cached pre-market and used throughout the trading day.

All daily indicators are cached pre-market based on yesterday's closing price. This allows for an accurate representation of a true N-day indicator. For example, to calculate a 14-day RSI indicator, the last 14 closing prices are fed into the RSI formula. This may deviate slightly from a daily technical indicator you see on a brokerage platform that attempts to simulate real-time indicators by using 13 previous closing prices, plus the last price of the security as the 14th bar in the RSI calculation.

The criteria "days until earnings" is also updated only at the beginning of each day and there are no additional updates for half a day passed.

#### Ticker Selection

The list of tradable tickers is a subset of all optionable underlying securities. We applied a heuristic filter for liquidity and volume to produce a set of approximately 350 tickers: minimum equity average 10-day volume of 1,000,000 shares and minimum option open interest of 4,000 contracts over the next two monthly expirations in the delta range of 15 to 60. The minimum share price threshold was set at $5.00/share.

From these lists we selected the top tickers from each, going down the lists to a point we felt had a good mix representing a cross-section of industry groups and included tickers we knew were popular with traders. We reviewed the lists and added a small number of tickers ad hoc that narrowly missed our liquidity filters, but we felt should also be included.

**Options**

For options, we looked at the two upcoming monthly expiration series only - no weekly or quarterly series. We looked for a minimum option open interest of 4,000 contracts over the next two monthly expirations in the delta range of 15 to 60. Over 90% of all contracts trade within this range.

The open interest for all strikes in this delta range for the two expirations is then totaled. This is the number we are checking against the 4,000 level to select tickers for options trading.

**Equity**

For equities, we simply look at daily volume - a minimum equity average 10-day volume of 1,000,000 shares. We also used 10 and 20-day average volume as a Goldilocks reference.


# Order Handling

Overview of how orders are handled between Option Alpha and the broker.

## Order Handling

Bots do not share an order ID with your broker. Each bot has a unique ID maintained by Option Alpha. Positions are tracked and managed independently of the broker. We submit a buy-to-close or sell-to-close order and the broker performs the reconciliation to determine whether or not the order is valid.

The broker reconciles a buy or sell-to-close order against existing positions. The closing order won't automatically reverse the order if it does not exist, it will error out.

When adding to an existing position, the bot will only manage the quantity it knows about. The additional quantity that was opened manually will need to be closed manually. You can manually override a position in the platform and the bot will no longer manage the position; you will need to manage the position through your broker. Additionally, overridden positions will no longer count against your daily or max position limits.

<figure><img src="/files/OiLlNwcxEbJkXXg6m9JL" alt="" width="563"><figcaption></figcaption></figure>

The bot will honor any instructions to close the position in your automations (or at expiration if ITM) as if it was still open. However, since you've externally closed the position, the broker will produce an error with a message informing you the position does not exist. At that point, you can still manually override the position in the bot so it doesn't try again.

{% hint style="info" %}
Users are encouraged to reach out to the broker for questions on their reconciliation proces&#x73;**.**
{% endhint %}

#### Position States

Bot Positions can be in four different states, *Open*, *Opening*, *Closed*, and *Closing*. When an order is passed from the automation to the broker service it changes state, and in the process is released from the bot temporarily until returned with an updated state. During this time, the bot is unaware of this position and will not be recognized as Open by other automations.

Positions that are in a *Closing* state are not recognized by other automations as *Open* while undergoing the closing process.

#### Partial Fills

All orders are submitted as timed limit orders. If a partial fill event is returned, we wait for the remaining position to be filled. On the subsequent partial fill(s) we reset the timeout, default to 2 minutes.

If no new partial fill event is received after the timeout expires, the remaining order is simply canceled, and the position status changes from "opening" to "open" with the partial quantity.

#### Assignment

Bots are unaware if an assignment occurs as this event is not reported back to us by the broker API. The bot will continue to track what it views as the original pre-assignment position. If the bot’s exit conditions are met, it will attempt to close the position.

Traders should monitor their broker platform for any positions that carry assignment risk and will need to manage the position from that end if assignment occurs. [Override the position](https://optionalpha.com/help/managing-positions) to remove it from the bot's management following an assignment.

#### Tax Lot Selection

A tax lot is a record of a transaction and its tax implications, including the purchase date and the number of shares. Each time you purchase a security, the new position is a distinct and separate tax lot, even if you already owned shares of the same security. A tax lot identification method is the way your broker will determine which tax lots are to be sold when you have a position consisting of multiple purchases made on different dates at differing prices, and you enter a trade to sell only part of the position. Your choice of tax lot ID method can have a significant impact on the amount of taxes you may pay when you sell an asset.

{% hint style="info" %}
Option Alpha does not pass tax lot information with the specific order to any of the brokers. Bots submit closing order requests for the options symbol used to open the position. Your brokerage account settings will determine tax lot treatment. If you have any questions on tax lot treatment, please reach out to your broker.
{% endhint %}

#### Option Expiration Protocol

Positions expiring in-the-money are subject to assignment and/or broker intervention based on the contract type and your account balance. Use this setting to auto-close ITM positions 10 minutes before expiration **OR** auto-override and manually enter the position results later.\
\
In your [Settings](https://app.optionalpha.com/login?rurl=%2Fsettings), you can select how you want your bots to handle expiring In-The-Money positions 10 minutes before market close on expiration day:

* Calculate estimated P/L from Underlying Price (default)
* Close position with a market order
* Override position and manually enter results

<figure><img src="https://cdn.prod.website-files.com/5fba23eb8789c3c7fcfb5f31/65d64f4540d054c9156f5d8f_OptionExpirationSelections.png" alt=""><figcaption></figcaption></figure>

Positions that have been overridden are no longer managed by the bot. It is the trader's sole responsibility to manage their positions and update the ending value with the [Position Editing function](https://optionalpha.com/help/managing-positions) and to ensure the bot's performance accurately reflects the outcome of expired positions that were released due to being In-The-Money. We recommend checking with your broker to confirm their expiration day position handling.

#### Trade Importing

The import system checks the position for 1) strategy compatibility 2) symbol compatibility 3) non-zero cost basis 4) non-zero quantity. In the event your position is not being recognized when importing it is likely because it violates one of those requirements.


# Bot Limitations

Learn the current limitations of the autotrading platform and how to navigate certain situations that are out of the bot's control.

## Bot Limitations

### Account Restrictions

Any restrictions placed on an account by the brokerage can only be restricted by that brokerage. Restrictions include EM Restrictions (Pattern Day Trader), Good Faith Violation, and Free Riding violation. Please note that all restrictions are imposed by the brokerage, not the Bot Platform, and need to be reconciled with the brokerage.

### Margin Calls

Bots have no knowledge of account type. They only know an allocation amount. All [Reg-T requirements](https://optionalpha.com/learn/margin-requirements) and [maintenance calls](https://optionalpha.com/learn/margin) for equity positions bought on margin should be managed through the brokerage platform.

### Exceeding Maximum Risk

Bot capital allocation limits are calculated at position entry. Market conditions at position closing may cause increased capital allocations beyond the calculated maximum risk at position entry. If the market is illiquid or bid-ask spreads are wide, bots have the potential to risk more capital at position exit than was allocated at position entry.

For example, if there is a wide bid-ask spread for a credit spread position, the ask price to close the spread may exceed the spread’s width. This is not solely a function of the bots. It is common for a credit spread to move against the trader and display P/L numbers beyond their max loss throughout the course of the trade. Therefore, it is best to consider *max risk* as the maximum risk **at expiration.**

As always, you have the ability to manually override positions, SmartPricing settings, exit criteria, and orders at any time. If you manually override a position, the Option Alpha platform no longer communicates with the position, and the position will not count against position limits or capital allocation limits. You may need to re-consider your bot’s capital allocation limit if you manually override positions.

More info on risk at expiration can be found under 'Forced Closures' in [Order Handling](https://optionalpha.com/help/order-handling).

### Earnings Changes

Company earnings dates can fluctuate and change on a regular basis for a variety of reasons. It is also common for the time of release to shift from AM and PM. The trader should remain aware of this at all times if they intended to use bots to trade earnings and manually intervene if necessary.

We currently do not provide a solution to differentiate between AM or PM earnings releases.

### Ticker Changes

Occasionally, corporations change their ticker symbol. Ticker symbol changes affect options chains and all identifiers for a security.

Bots do not automatically update or change to a newly issued ticker in the event of a ticker change. Traders should be aware of all corporate actions that could cause a ticker change to occur for any of the stocks or ETFs they're trading. Please reference the[ OCC website](https://infomemo.theocc.com/infomemo/search) to review and maintain up-to-date information on any changes that would affect the symbols used within the bots.

### Stock Splits & Corporate Actions

Stock splits, reverse splits, stock dividends, spin-offs, mergers, special dividends, buyouts, and ticker symbol changes create unique situations for autotrading.

[Stock splits](https://optionalpha.com/learn/stock-split), [reverse splits](https://optionalpha.com/learn/reverse-stock-split), and stock [dividends](https://optionalpha.com/topics/dividends)\* change the number of shares in a position.

Stock splits and stock dividends\* increase the number of shares in a position. Reverse splits decrease the number of shares in a position.

For example, a two-for-one stock split would double the number of shares outstanding and give every shareholder two shares for every share owned while reducing each share’s value by half.

<figure><img src="https://2799944806-files.gitbook.io/~/files/v0/b/gitbook-x-prod.appspot.com/o/spaces%2F-MYjluAVRcRcfh1YL43z%2Fuploads%2F889RJOz1k878R8B6O17w%2F66b26ad80157b5794a0f86cc_605cdc1905db417898350415_1016138_Stocksplitreversestocksplit1_032521.png?alt=media&#x26;token=7251ff54-2049-42c1-b818-4a32d4f73a5a" alt=""><figcaption></figcaption></figure>

\*Stock dividends, as opposed to cash dividends, are paid to shareholders in additional shares rather than cash.

Spin-offs, mergers, special dividends, and buyouts may impact the cost basis for positions, impact the options chain identifier, define a different deliverable for the options contract, or a combination of those impacts.<br>

Bots manage positions based on the quantity and underlying option symbol at the time the position was opened. Changes in the position’s characteristics (such as the number of shares or symbol) after the position was opened are outside the scope of the bot’s management visibility.

Upon closing, the bot will attempt to close the entire position as it was opened, so the bot is unaware of symbol or quantity changes and unable to successfully close positions affected by these corporate actions.

If your bot is managing a security that announces a stock split, reverse split, stock dividend, spin-off, merger, special dividend, buyout, or ticker symbol change, the appropriate action is to manually override the position.

[Manual override](https://optionalpha.com/help/managing-positions) enables you to release a position from the bot’s management or manually close a position through your broker’s platform (not in the Option Alpha platform). The position would no longer exist in the Option Alpha platform, so this is a great tool to take back management of a position.

To override an open position, choose a position and select “Override” in the Position Details.

<figure><img src="https://cdn.prod.website-files.com/5fba23eb8789c3c7fcfb5f31/66b26ad80157b5794a0f895b_66b26ad242ccec51382425ec_position-override.png" alt=""><figcaption></figcaption></figure>

Overriding a position disconnects the position from the bot and transfers it to your broker platform for manual management. If you manually override a position, the Option Alpha platform no longer communicates with the position, and the position will not count against position limits or capital allocation limits.

{% hint style="info" %}
Overriding a position does not automatically close a position. The position remains open in your brokerage account, and you are responsible for the position’s management.
{% endhint %}

The position’s original details are still available. Any actions performed manually after the position has been overridden, such as closing orders and final P/L, are not visible in the bot.

If you have a bot that scans for new position opportunities in a security with these corporate actions, you may either turn off the bot or remove scanners with the affected symbol.

When automations are off, they no longer run at their scheduled interval. Any open positions inside the bot will remain open but will no longer be managed by the bot. You can turn automations on or off at any time.

Remember, [automated does not mean unattended](https://optionalpha.com/blog/automated-does-not-mean-unattended). An essential part of autotrading is to pay careful attention to the tickers you trade so that you are not adversely affected by corporate actions.


# Supported Ticker Symbols

The complete list of all stock and ETF ticker symbols available for autotrading in Option Alpha.

## Supported Ticker Symbols

Option Alpha currently supports more than 340 ticker symbols. Learn more about the selection criteria [here](/technical-documentation/platform/data-feeds).

### **Stocks**

A, AA, AAL, AAP, AAPL, ABBV, ABNB, ABT, ACN, ADBE, ADI, ADM, ADP, ADSK, AEP, AES, AFL, AFRM, AGNC, AIG, AI, AKAM, ALB, ALK, ALL, AMAT, AMD, AMGN, AMRN, AMZN, ANET, APA, APH, APTV, ARM, ASML, AVGO, AXP, BA, BABA, BAC, BAX, BBY, BEN, BIDU, BIIB, BKR, BMY, BP, BSX, BX, BYND, C, CAH, CAT, CB, CCI, CCL, CCJ, CF, CFG, CHWY, CI, CL, CLF, CLX, CMCSA, CME, CNC, CNP, COF, COIN, COP, COST, CPB, CPRI, CRM, CRON, CRWD, CSCO, CSX, CTVA, CVNA, CVS, CVX, CZR, D, DAL, DD, DE, DELL, DHI, DHR, DIS, DKNG, DLR, DOCU, DOW, DRI, DVN, DXC, EBAY, ED, EIX, EL, EMR, ENPH, EOG, EQT, ETSY, EVRG, EW, EXC, EXPE, F, FANG, FAST, FCX, FDX, FE, FITB, FOXA, FSLR, FTI, FTV, GD, GE, GILD, GLW, GM, GME, GOOG, GOOGL, GPRO, GS, HAL, HBAN, HCA, HD, HIG, HLT, HOG, HON, HOOD, HPE, HPQ, IBM, ICE, INTC, IONQ, IP, IRM, IVZ, JCI, JD, JNJ, JPM, KHC, KMI, KO, KR, KSS, LEN, LI, LKQ, LLY, LMT, LNC, LOW, LUMN, LUV, LVS, LYB, LYFT, MA, MAR, MARA, MAS, MCD, MCHP, MDLZ, MDT, MET, META, MGM, MMM, MO, MOS, MPC, MRK, MRNA, MRVL, MS, MSFT, MSTR, MTB, MU, MTCH, NCLH, NEE, NEM, NET, NFLX, NKE, NOW, NRG, NTAP, NTES, NVAX, NVDA, NWL, NWSA, O, OKE, OMC, ON, ORCL, OXY, PANW, PBR, PDD, PENN, PEP, PFE, PFG, PG, PGR, PINS, PNC, PPL, PLTR, PRU, PSX, PTON, PYPL, QCOM, RBLX, RCL, RDDT, RF, RIOT, RIG, RIVN, ROKU, ROST, RTX, RUN, SBUX, SCHW, SEDG, SHOP, SIRI, SLB, SMCI, SNAP, SNDK, SNOW, SO, SOFI, SPCX, SPG, STX, SWKS, SYF, SYY, T, TAP, TCOM, TDOC, TFC, TGT, TJX, TMO, TMUS, TPR, TRIP, TRV, TSLA, TSM, TSN, TT, TTD, TTWO, TXN, U, UA, UAA, UAL, UBER, ULTA, UNH, UNM, UNP, UPS, UPST, URBN, USB, V, VALE, VFC, VRT, VTR, VZ, WAB, WBD, WDC, WFC, WM, WMB, WMT, WU, WY, WYNN, XEL, XOM, XRX, XYZ, YELP, ZION, ZM

### **ETFs**

BITO, DIA, EEM, EFA, EWJ, EWW, EWY, EWZ, FXE, FXI, GDX, GLD, HYG, IBB, IBIT, IEF, IWM, IYR, JETS, KRE, KWEB, LQD, OIH, QQQ, SCHD, SGOV, SLV, SMH, SOXL, SOXS, SPXL, SPXS, SPY, SQQQ, TBT, TLT, TQQQ, UNG, USO, UVXY, VGK, VXX, XBI, XHB, XLB, XLC, XLE, XLF, XLI, XLK, XLP, XLRE, XLU, XLV, XLY, XOP, XRT, YINN

### **Indexes**

SPX, XSP

#### **Trade Ideas**

AAL, AAPL, ABBV, ABT, ADI, ADM, ADBE, ADP, ADSK, AIG, AMAT, AMD, AMGN, AMZN, APA, AVGO, AXP, BA, BABA, BAC, BBY, BIDU, BMY, BP, BSX, BX, BYND, C, CCL, CAT, CF, CHWY, CL, CLF, CLX, CMCSA, COF, COP, COST, CRM, CRWD, CSCO, CVS, CVX, CZR, DAL, DD, DE, DHI, DIA, DIS, DKNG, DOCU, DOW, DVN, EBAY, EEM, EFA, EIX, EOG, EWJ, EWW, EWZ, EXPE, F, FCX, FDX, FITB, FSLR, FXI, GDX, GE, GILD, GLD, GM, GOOG, GOOGL, GS, HAL, HD, HON, HPQ, HYG, IBM, IBB, IBIT, INTC, IWM, IYR, JD, JNJ, JPM, KMI, KO, KR, KRE, KSS, LEN, LLY, LOW, LQD, LUV, LVS, LYFT, MAR, MARA, MCD, MCHP, MDT, MDLZ, MET, META, MGM, MMM, MO, MOS, MPC, MRK, MRNA, MRVL, MS, MSFT, NCLH, NEE, NEM, NET, NFLX, NKE, NOW, NRG, NTAP, NVDA, OIH, OMC, ORCL, OXY, PEP, PFE, PG, PGR, PLTR, PNC, PSX, PYPL, QCOM, QQQ, RCL, RIG, ROKU, ROST, RTX, SBUX, SCHW, SHOP, SLB, SLV, SMH, SO, SPG, SPY, STX, T, TBT, TCOM, TGT, TJX, TLT, TMUS, TSLA, TSM, TSN, TTD, TXN, UAL, UBER, ULTA, UPS, USB, USO, V, VFC, VXX, VZ, WDC, WFC, WMT, WYNN, XBI, XHB, XLC, XLB, XLE, XLF, XLI, XLK, XLP, XLU, XLV, XLY, XOM, XOP, XRT, XSP, ACN, XYZ, ZM

Download CSV format [here.](https://docs.google.com/spreadsheets/d/1mnl4_KfHJM-r-Fbjm2B1c-Ta3eh2hCLI5ew2JWJasww/edit?gid=0#gid=0)

{% hint style="info" %}
Additional symbols may be added to the database at a future date based on popularity and liquidity.
{% endhint %}


# Supported Browsers

The autotrading platform is browser-based to offer flexibility and accessibility to our users. Here is what you need to know about supported browsers.

## Supported Browsers

The Option Alpha autotrading platform is browser-based to offer flexibility and accessibility to our users. Instead of requiring a downloaded desktop client, the browser-based platform provides multiple opportunities from both an engineering and user experience perspective.

Officially supported browsers for the autotrading platform include:

* Google Chrome ([Install](https://www.google.com/chrome/))
* Microsoft Edge ([Install](https://www.microsoft.com/en-us/edge))<br>
* Apple Safari ([Install](https://www.apple.com/safari/))
* Mozilla Firefox ([Install](https://www.mozilla.org/en-US/firefox/))

In general, most Chromium-based browsers that run the V8 JavaScript engine needed for the platform are supported. Firefox, for example, runs on a different engine and is not officially supported at this time. These browsers are based on Chrome or Safari and may also work:

* Brave Browser ([Install](https://brave.com/))


# Supported Countries

Our brokerage partnerships bring our autotrading platform to traders in 120+ countries. Learn more about platform access by country.

## Supported Countries

Through our brokerage support, Option Alpha is available to traders in 120+ countries around the world. The list of [broker integrations](https://optionalpha.com/integrations) and supported countries is growing and subject to change.

Brokerage firms may change their list of supported countries at any time, either to add or remove countries, so be sure to check with your broker to see if your country is supported.

**The following countries are supported by TradeStation and Tradier Brokerage:**

* United States
* Åland Islands
* Algeria
* American Samoa
* Andorra
* Angola
* Anguilla
* Antarctica
* Antigua and Barbuda
* Argentina
* Armenia
* Aruba
* Austria
* Bahrain
* Bangladesh
* Belgium
* Belize
* Benin
* Bermuda
* Bhutan
* Bolivia
* Bonaire, Sint Eustatius and Saba
* Bouvet Island
* Brazil
* British Indian Ocean Territory
* Bulgaria
* Cabo Verde
* Chile
* China
* China, Hong Kona Special Administrative Region
* China, Macao Special Administrative Region
* Christmas Island
* Cocos (Keeling) Islands
* Colombia
* Comoros
* Congo
* Cook Islands
* Costa Rica
* Côte d’Ivoire
* Curacao
* Cyprus
* Czechia
* Denmark
* Djibouti
* Dominica
* Dominican Republic
* Ecuador
* Egypt
* El Salvador
* Equatorial Guinea
* Estonia
* Eswatini
* Falkland Islands (Malvinas)
* Faroe Islands
* Fiji
* Finland
* France
* French Guiana
* French Polynesia
* French Southern Territories
* Gabon
* Gambia
* Germany
* Greece
* Greenland
* Grenada
* Guadeloupe
* Guam
* Guatemala
* Guinea
* Guinea-Bissau
* Heard Island and McDonald Islands
* Holy See
* Honduras
* Hungary
* Iceland
* India
* Indonesia
* Ireland
* Isle of Man
* Israel
* Italy
* Jamaica
* Japan
* Jersey
* Kazakhstan
* Kiribati
* Kuwait
* Kyrgyzstan
* Lesotho
* Liberia
* Liechtenstein
* Lithuania
* Luxembourg
* Madagascar
* Malawi
* Malaysia
* Maldives
* Marshall Islands
* Martinique
* Mauritania
* Mayotte
* Mexico
* Monaco
* Mongolia
* Montserrat
* Namibia
* Nepal
* Netherlands
* New Caledonia
* New Zealand
* Niger
* Niue
* Norfolk Island
* Northern Mariana Islands
* Norway
* Oman
* Papua New Guinea
* Paraguay
* Peru
* Pitcairn
* Poland
* Portugal
* Qatar
* Republic of Korea
* Réunion
* Romania
* Rwanda
* Saint Barthélemy
* Saint Helena
* Saint Kitts and Nevis
* Saint Lucia
* Saint Maarten (Dutch part)
* Saint Martin (French part)
* Saint Pierre and Miquelon
* Saint Vincent and the Grenadines
* Samoa
* San Marino
* Saudi Arabia
* Serbia
* Seychelles
* Singapore
* Slovakia
* Slovenia
* Solomon Islands
* South Georgia and the South Sandwich Islands
* Spain
* State of Palestine
* Suriname
* Svalbard and Jan Mayen Islands
* Sweden
* Switzerland
* Tajikistan
* Thailand
* Timor-Leste
* Togo
* Tokelau
* Tonga
* Turkmenistan
* Turks and Caicos Islands
* Tuvalu
* United States Minor Outlying Islands
* Uruguay
* Uzbekistan
* Virgin Islands (U.S.)
* Wallis and Futuna Islands
* Western Sahara
* Zambia

**In addition, TradeStation also supports the following countries:**

* Australia
* Azerbaijan
* Bahamas
* Brunei Darussalam
* Cameroon
* Cape Verde
* Cayman Islands
* Croatia
* Czech Republic
* Fed. States of Micronesia
* Georgia
* Gibraltar
* Guernsey, C.I.
* Hong Kong
* Jordan
* Lao People's Democratic Republic
* Latvia
* Mozambique
* Nauru
* Palau
* Philippines
* Puerto Rico
* Republic of Moldova
* Sao Tome and Principe
* Scotland
* South Africa
* St. Vincent and the Grenadines
* Taiwan
* Trinidad and Tobago
* Turkey
* United Arab Emirates
* United Kingdom of Great Britain and Northern Ireland
* United Republic of Tanzania
* Vietnam
* Virgin Islands (British)

**tastytrade supports the following international countries:**

* Andorra
* Argentina
* Australia
* Austria
* Bahrain
* Belgium
* Bolivia
* Bulgaria
* Brazil
* Chile
* Colombia
* Czech Republic
* Denmark
* Dominican Republic
* Ecuador
* Egypt
* Estonia
* Finland
* France
* French Polynesia
* Germany
* Greece
* Hungary
* Iceland
* India (cash accounts only)
* Indonesia
* Ireland
* Isle of Man
* Israel
* Italy
* Kuwait
* Malaysia
* Monaco
* Mexico
* Namibia
* Netherlands
* New Zealand
* Norway
* Peru
* Poland
* Portugal
* Romania
* San Marino
* Saudi Arabia
* Singapore
* Slovakia
* Spain
* Sweden
* Switzerland
* Taiwan
* Thailand
* UK
* Uruguay


# Ex Dividend & Earnings Dates

The frequency, schedule, and projected ex-dividend dates for Option Alpha's supported ETFs. Dates are an estimation and subject to change.

## Ex Dividend & Earnings Dates

Earnings and ex-dividend dates are an integral part of financial markets. Many of Option Alpha's supported tickers pay a dividend. However, ex-dividend and earnings dates are often rescheduled. To ensure redundancy, we employ two different data sources for the earnings dates showing in our calendar.\
\
ETF ex-dividend dates have been manually added to the platform using the providers distribution schedule or the projected recurring schedule based on historical data. Future dates are an estimation and subject to change.

{% hint style="info" %}
We encourage the community to participate in this process and ensure that the dates are accurate.
{% endhint %}

Here are links to the 2024 Distribution Schedules for most of the [supported ETFs](https://optionalpha.com/help/supported-ticker-symbols)\
‍\
[BlackRock iShares](https://www.ishares.com/us/literature/shareholder-letters/isharesandblackrocketfsdistributionschedule.pdf) (EEM, EFA, EWZ, FXI, HYG, IWM, IYR, LQD, TLT, EWJ, EWY, EWW, IBB)\
[StateStreet SPDRs](https://www.ssga.com/library-content/products/fund-data/etfs/us/distribution/SPDR_Dividend_Distribution_Schedule.pdf) (DIA, KRE, SPY, XBI, XHB, XLB, XLE, XLF, XLK, XLP, XLU, XLY, XOP, XRT, XLC, XLI, XLRE, XLV)\
[VanEck](https://www.vaneck.com/us/en/vaneck-etfs-distributions-schedule-2024.pdf) (GDX, OIH, SMH)\
[Direxion](https://www.direxion.com/press-release/etf-distributions) (SPXL, SPXS)\
[Proshares ](https://www.proshares.com/resources/distribution-schedules)(TBT, SQQQ, TQQQ)

The following ETFs do not currently offer a dividend and are excluded from the calendar:

* GLD
* SLV
* UNG
* USO
* UVXY
* VXX
* XSP


# Options Expiration Protocol

Managing Expiring ITM Positions in Option Alpha

#### Managing Expiring ITM Positions in Option Alpha

Option Alpha uses protocols for expiring positions based on their [moneyness](https://optionalpha.com/learn/options-moneyness).

{% hint style="info" %}
You should communicate with your broker about their guidelines for handling positions on expiration day.
{% endhint %}

Positions expiring in-the-money are subject to assignment and/or broker intervention based on the contract type and your account balance.

By default, the bot will calculate the estimated P/L from the underlying's closing price at the end of expiration day. The bot WILL NOT send an order to close the position. Live positions expiring in-the-money are subject to assignment/exercise by your broker.

In your [Settings](https://app.optionalpha.com/login?rurl=%2Fsettings), you can select how you want your bots to handle expiring In-the-Money positions at expiration:

* Calculate estimated P/L from underlying close price (**Default**)
* Close position with a market order
* Override position and manually enter results

<figure><img src="https://2799944806-files.gitbook.io/~/files/v0/b/gitbook-x-prod.appspot.com/o/spaces%2F-MYjluAVRcRcfh1YL43z%2Fuploads%2FPSN35g6XjhQHa1VyhppJ%2FCleanShot%202025-10-30%20at%2014.09.24.png?alt=media&#x26;token=a084d4f4-f8b6-4053-87d2-49b9e624cb20" alt=""><figcaption></figcaption></figure>

Positions that have been overridden are no longer managed by the bot. It is the trader's sole responsibility to manage their positions and update the ending value. We recommend checking with your broker to confirm their expiration day position handling.

Option Alpha does not close option positions that are Out-of-the-Money (OTM) on expiration day. Contracts that expire OTM are worthless and you will realize the full loss for long positions or the full profit for short positions. Option Alpha last checks a position's moneyness 10 minutes before the market closes. Note that options are eligible for [assignment](https://optionalpha.com/learn/option-assignment) after-hours.

<figure><img src="https://cdn.prod.website-files.com/5fba23eb8789c3c7fcfb5f31/641894156f6a2a830779e263_yBUiwweThhThnlv0jOyog4fkx0_kntOIvYs1XinPimZHBBttE5SmQfTNpNjVuQbxUWBxrU6Ab-e_QiNx94zf-YjnhIWCYcgvYcZUvBhY0CUK_Sq2jdQAsT8qrlds5MMmkyK9zo3paxYJ5Z7I_h2Qu_I.png" alt="Expired positions"><figcaption></figcaption></figure>

It is the trader's sole responsibility to update the ending value of their position using the Position Editing function and to ensure the bot's performance accurately reflects the outcome of expired positions released due to being In-the-Money.

Generally, early closure rules depend on whether the account has the funds to cover an assignment, whether the position is ITM, OTM, or ATM, and the account type where the expiring position is held. Check with your broker for more information.

If you want to take assignment of an expiring position, you must manually override the position to transfer management from the bot. If you select 'Override position and manually enter results' in your [Settings](https://app.optionalpha.com/login?rurl=%2Fsettings), the bot will automatically override the position at 3:50 pm EST.

<figure><img src="https://cdn.prod.website-files.com/5fba23eb8789c3c7fcfb5f31/64189415f143773cd6828777_FrYzuXBYWyNUHvUo60FMfajMqYsbS4q1856qhbBzU7NyX0gAp6k82I-N4v3qa4UZJOiSeJKGcz-LGIJ47rgf7RMccZBootvaxr3R60Kue0S32iLI7LzH-AbkKDMs9Mbq3g1islj3uK8PCg8eV_1eQ0E.png" alt="Override position"><figcaption></figcaption></figure>

You can see positions you override under the bot's 'Closed Positions.'

<figure><img src="https://cdn.prod.website-files.com/5fba23eb8789c3c7fcfb5f31/64189415ebfd2010b0c468cf_T2BkM6cuQFmsavA2vU9SqQD_lNUT77CdYoiHl0cvzzb8jt35RHmpjprDr2VQM-ECDJCe_n2miDQQIcROVd0Hj5TwqN0AJvnPJDQ3BRP3ly8wxt0Dy-05zXIj7Fa2osAdavSXK5c1kBtJUIhPhUwSw30.png" alt="Overridden position"><figcaption></figcaption></figure>

It is important you understand the options expiration protocol of both Option Alpha and your broker and take the necessary steps to avoid or accept assignment of options positions.[‍](https://optionalpha.com/blog/assigned-position-management)

{% hint style="info" %}
Bots do not support options assignment. Bots are unaware when an assignment occurs in your brokerage account. The autotrading platform tracks and manages positions independent of the broker. You must use the broker platform to manage assigned shares and any remaining option legs.
{% endhint %}

The autotrading platform submits a buy-to-close (BTC) or sell-to-close (STC) order and lets the broker perform reconciliation if the order is valid.

The broker reconciles a buy-to-close or sell-to-close order against existing positions. Buy-to-close (BTC) or sell-to-close (STC) orders do not automatically reverse if the position does not exist (go long or short instead). Instead, the orders will generate an error message.

If the autotrading platform attempts to close a position that has been assigned, the bot will receive an error message for the closing order, and no action will be taken.


# Autotrading Best Practices

A list of popular do's and don'ts to help guide your autotrading.

Following the best practices discussed in this article, such as paper trading, understanding live fills, thorough bot comprehension, organization, and preparation, can significantly improve your chances of successful autotrading. By adopting these practices and remaining disciplined in your approach, you can navigate the markets more confidently and effectively with Option Alpha's autotrading platform.

{% embed url="<https://youtu.be/BZYGVz6vJNE?si=awJzPcUDnrskXK_o>" %}

Here are the "Do’s and Don’ts" for successful autotrading at Option Alpha:

## Do’s

### **Think through your bot's logic from entry to exit**

**‍**The main challenge in automated trading is thoroughly considering the entire trading process. Traditionally, traders could make changes dynamically; but with autotrading, the entire process must be planned from entry to exit. Automation involves creating a structured plan for the bot, essentially turning your trade strategy into decision-based instructions.

Before building your bot, you should meticulously design your trading strategy, map out each decision point, and outline the trade process. You can then translate this strategy into an automation using if/then statements.

Key factors to consider include asset type, capital allocation, trading frequency, market stance, evaluation criteria, indicators, and exit plans. Think about the big picture of the bot and narrow down your objective:

* Do you want to trade stocks, ETFs, or options?&#x20;
* How much of your total capital do you want to allocate?&#x20;
* How many positions do you want to enter daily? Total?&#x20;
* Are you bullish, bearish, or neutral on the underlying asset?
* What market criteria do you want to evaluate?
* What kind of indicators do you use?
* When and why do you plan to exit the trade?

Once the framework is ready, you can use the automation editor to execute the bot's actions.

It's best to test automations and paper trade the bot before using real funds to ensure it meets your expectations. Ultimately, as a trader, you're responsible for designing the trade plan and instructing the bot accordingly.

### **Paper trade before going live**

Before deploying your bots in live trading, it is crucial to test your strategies in a risk-free environment using the in-app paper trading account. Paper trading allows you to simulate real market conditions that can help observe and refine your strategy. We suggest paper trading for a minimum of 30-60 days before risking any live capital.

Paper trading your bot allows you to answer key questions about the bot's functionality:

* Did the framework you created do what you expected?
* Did the bot enter the positions you anticipated?
* Did your closing actions exit positions according to your plan?

### **Test the same way you expect to go live**

If you are starting out with $10K of capital and will begin trading with one contract, then you should calibrate your paper bots to use the same allocation and position size. This ensures that your expectations and behavior will not vary drastically when shifting to live trading.**‍**

### **Adjust live pricing expectations**

It's important to recognize that live fills are not guaranteed and that the symbols and strategy you choose to trade can affect the difference in results between live and paper trading. The favorable fill prices provided by paper trading engines may differ from live market executions. Be prepared for slight variations and adjust your expectations accordingly.

### **Get comfortable with how the bot works**

**‍**Before going live with your bot, you should be comfortable with the logic and actions you are using. Familiarize yourself with the indicators, triggers, and logic employed by your bot. Read the [bot logs](https://optionalpha.com/help/bot-logs) to fully understand when and why trades are opening or closing. Observing your bot’s activity will give you a complete understanding of how it operates and will enable you to make informed decisions to optimize your bot's performance effectively.**‍**

### **Utilize bot notes and titling**

**‍**Stay organized by utilizing the bot notes section to document your observations and any adjustments made to the bot's settings. Additionally, give your bots unique icons and descriptive titles to identify their purposes and strategies easily. **‍**

### **Familiarize yourself with broker rejection errors**

**‍**Prepare for potential [broker rejection errors](/technical-documentation/troubleshooting/broker-rejection-errors) by understanding their causes and implications. Always utilize the Entry and Position criteria and the Pattern Day Trading (PDT) check inside Exit Options to mitigate some common errors and issues.

### **Understand option expiration & assignment**

Bots have certain limitations you should be aware of. For example, bots do not know if an option is assigned. We suggest you have a detailed understanding of the option expiration protocol and adjust your account's position management settings accordingly.

Typically, in-the-money options have a higher chance on or near expiration day. Expiring trades, specifically short-term and 0DTE positions, should be managed accordingly. Option Alpha's Exit Options have safeguards for exiting position's on expiration day to manage assignment risk. Remember, assignment is random and unpredictable.

<figure><img src="https://cdn.prod.website-files.com/5fba23eb8789c3c7fcfb5f31/6430365a8fd825548068317b_Expiration%20day%20exit%20options.png" alt="Managing options positions on expiration day"><figcaption></figcaption></figure>

As always, we recommend talking to your broker about specific position handling near expiration. Some brokers may choose to automatically close positions prior to the end of the trading day. Also note that out-of-the-money options can still be exercised after-hours. Learn more about [options settlement](https://optionalpha.com/topics/options-settlement).

### **Use a Guard to Protect Trailing Stops from Wide Bid/Ask Spreads**

Volatile markets can lead to erratic pricing and wide bid/ask spreads. You can use a bid/ask guard to automatically disable Exit Options and ignore position returns until pricing becomes more rational. If the bid/ask spread is larger than your acceptable price, Exit Options won’t send an order. It also won’t record the position’s high or low.

{% embed url="<https://vimeo.com/817389641>" %}

## Don’ts**‍**

### **Blindly clone bots from the community and run live**

**‍**It's tempting to want to trade live as soon as possible and especially after encountering bots made by others in the community that show signs of success. However, we suggest you always paper trade and understand all of the bot's components before risking your own capital; regardless of the author or shared results. Bots are simply decision logic that has been combined into a set of instructions to form a strategy. The name, the author, and the recent results are all secondary components to this underlying truth. You, as the trader, need to determine if that strategy is right for you, and we encourage everyone to interview bots and make sure they’re worthy of trading your hard-earned cash.**‍**

### **Stack multiple Open Position actions**

**‍**Running multiple open position actions, one after another, can lead to undesirable outcomes. Because there are no guarantees either order will be filled, it's important to utilize an event trigger when scheduling automations for your secondary entries and ensure that positions are opening in a more orderly sequence.**‍**

<figure><img src="https://cdn.prod.website-files.com/5fba23eb8789c3c7fcfb5f31/64dfc81f37bfbfec1e62f0c5_Stacking%20open%20position%20actions.png" alt="Stacking open position actions"><figcaption></figcaption></figure>

### **Simultaneously use Open and Close actions in the same automation**

**‍**Similar to stacking multiple open actions, you should avoid combining Open and Closing actions in the same automation path. When an order is sent to the broker for execution, the bot state changes, and the order is essentially detached temporarily from the bot until the order is returned with updated details. When combining Open and Closing actions, you will run into situations where the ‘Position’ is unknown to the bot and an error will be generated.**‍**

<figure><img src="https://cdn.prod.website-files.com/5fba23eb8789c3c7fcfb5f31/64dfc861a9627bddf0ce469f_Stacking%20open%20and%20close%20position%20actions.png" alt="Stacking open and close position actions"><figcaption></figcaption></figure>

### **Create duplicate ‘Symbol’ or ‘Position’ inputs**

**‍**Instead, use the default symbol or position inputs supplied by the Loop. If you start the automation with a Loop, all subsequent decisions that require referencing a symbol or position will be linked automatically to that Loop and will display the infinity icon vs. the chain link.**‍**

<figure><img src="https://cdn.prod.website-files.com/5fba23eb8789c3c7fcfb5f31/64dfc8bcf550378982ca9b2c_Connected%20loops.png" alt="Connecting loops to decision actions"><figcaption></figcaption></figure>

### **Use more than one Loop**

**‍**It's best to start each automation with a symbol Loop in scanner automations or position loops in monitor automations. Adding additional loops at different sections of the automation can lead to mixed-up inputs and generate errors.

<figure><img src="https://cdn.prod.website-files.com/5fba23eb8789c3c7fcfb5f31/64dfc8b28c6649c4085c512b_Multiple%20loops.png" alt="Using multiple loops in an automation"><figcaption></figcaption></figure>

### **‍‍Trading the exact same strategy in multiple bots**

**‍**Running multiple instances of the exact same bot when trading live can potentially create issues with your broker. The broker often perceives entry and exits in the same positions are manipulative behavior and will flag your account accordingly. Stick to a single instance for each bot unless there are differences in their trade details.

### Ignore your brokerage account

Remember, automated does not mean unattended. We strongly recommend that you continue to check your broker account, positions, and order activity on a regular basis. Bots are not aware of early assignment, so your Option Alpha autotrading account will not reflect any change to positions that did not occur within the platform. We also suggest you speak directly to your broker about their position management and associated fees so you're aware of their procedures.


# Calculations


# Profit and Loss

An overview of how profit and loss are calculated and displayed on the bot dashboard.

## Profit and Loss

The bot dashboard shows the lifetime position metrics for a bot. The daily P\&L chart requires at least 3 data points, i.e., 3 closing values on the portfolio across 3 market days before a graph is displayed. The active profit and loss value is updated each time the page is refreshed. The Activity Window will summarizes all bot activity.

<figure><img src="https://cdn.prod.website-files.com/5fba23eb8789c3c7fcfb5f31/648713d804ed8882c4cb8679_Profit%20and%20Loss.png" alt=""><figcaption></figcaption></figure>

{% hint style="info" %}
All End-of-Day profit and loss calculations are settled daily at 4:15 Eastern Time (ET) During the 15-minute period after the close, bid/ask spreads can become extremely wide which will cause the Daily P/L on your bot dashboard to become skewed. Do not panic!
{% endhint %}

### Activity Window

The activity window provides a snapshot overview of the total count for bot automations and decisions along with daily counts for open and closed positions. In addition, any tickers that have been referenced and any warnings or errors are also shown on a daily basis.

[Warnings and errors](https://docs.optionalpha.com/platform-1/troubleshooting/capital-warnings) will be cleared and reset prior to the market opening the following day.

<figure><img src="https://cdn.prod.website-files.com/5fba23eb8789c3c7fcfb5f31/64da7e04d351c3cab9547b21_profit%20and%20loss%20table.png" alt=""><figcaption></figcaption></figure>

#### Available Capital (Example)

Assume a new bot is allocated $2,500 capital.

1\) The bot opens a $5 wide short put spread and receives $1.75 ($175) credit.

2\) Another $5 wide short put spread opens for a $1.50 ($150) credit.

The bot now has $2,825 in capital (original allocation $2,500 + $175 + $150). Both short put spread have a $500 maintenance. The total maintenance requirement for the open positions is $1,000.

$2,825 - $1,000 = $1,825. The $1,825 is the available capital.

{% hint style="info" %}
The Available Capital calculation includes pending orders to prevent exceeding max allocation.
{% endhint %}

### Performance Metrics

#### Total P/L & Return %

The active profit and loss value is updated each time the page is refreshed and is the total of both active and closed positions (realized and unrealized gains or losses).

Return on investment measures the effectiveness of an investment relative to its initial cost of entry. ROI divides the return of an investment by the cost of the investment.

For example, if an investment cost $5,000 to purchase and is now worth $6,000, the ROI for the investment is 20% ($6,000-$5,000 = $1,000 / $5,000).

#### Change & Change %

The Change P/L and Change % measure the change in P/L from yesterday.\
\
Change % is the change in P/L between yesterday and today divided by yesterday's bot "value" (the total worth of the bot, including open positions). When the bot has no previous day's value that can be used, the allocation is used to provide a starting value.

#### Win Rate

The win rate divides the total number of winning trades by total trades. For example, if an investor has placed 200 trades and has realized a profit on 120 of them, the win rate is 60% (120/200).

While the win rate can identify how successful trades are at generating profit, it is not as important as the profit factor or how much is gained or lost on each trade. For example, an investor may have a 60%-win rate, but if they lose 3x as much when they lose as they make when they win, they will still lose capital over time.

#### Profit Factor

The profit factor divides the total amount of money gained by the total amount of money lost. Profit factor is important when used in conjunction with the win rate because it creates a more complete view of trading performance.

For example, if an investor has placed 200 trades with a win rate of 60% and averages $50 per winning trade and $50 per losing trade, their profit factor will be 1.5 with a net profit of $2000 ((120 x $50 = $6,000) / (80 x $50 = $4,000)).

Compare this with an investor who has a 60%-win rate on 200 trades but a profit factor of .5 because they average $50 per winning trade, but $150 per losing trade ((120 x $50 = $6,000) / (80 x $150 = $12,000)). They will have a net loss of -$6,000, despite the same win rate.

#### Max Drawdown

Maximum drawdown is a measure of the greatest fall in value from the peak high point to the lowest point before a new peak is achieved. This is also displayed as a percentage to further help identify how drastic of a peak to valley drawdown has been experienced over the course of the charted performance graph.

If the bot's P/L value does not cross below 0, the performance graph will use 0 as the low point anchor and only display a maximum peak value alongside the current P/L value.

#### Averages

Avg P/L is the average gain or loss for all closed positions. (Closed P/L ÷ Closed positions).

Avg Win is the average gain for all winning positions. (Closed P/L of winning trades ÷ Number of winning trades)

Avg Loss is the average loss for all losing positions. (Closed P/L of losing trades ÷ Number of losing trades)

#### Position Value

The position "value" is a function of the currentPrice of a share or contract multiplied by the number of contracts, where the currentPrice is synonymous with the matched opportunity mark. Each Position is tracked as a combination of legs, where each leg has/is a security object. Every time we quote the Position, we build an opportunity out of all of the position legs and compare it to the saved values for where the Position opened to provide an accurate quote. For example, if we have a 425/400 short put spread and we want to know the P/L, we pull quotes for the 425 put and 400 put independently and then combine them into a short put spread opportunity. This provides the value X of this short put spread right now and now subtract the value of the original position, Y, from X, and that's the P/L.

To obtain the total open P/L, sum the resultant values for every open position.

### Differences between Option Alpha and Broker P/L

It's important to note that the P/L displayed on the Option Alpha platform may differ from what is shown on your brokerage platform or statements. In this article, we'll explore the reasons that may cause traders to notice a difference when comparing P/L on Option Alpha and their brokerage platform.\
\
Option Alpha receives order IDs and fill prices directly from the broker. While this data exchange ensures accuracy, it is essential for traders to cross-reference this information with their broker's platform to ensure consistency.

#### **Valuation Methodology**

One significant distinction lies in how Option Alpha and brokers evaluate the value of positions. Option Alpha values all positions based on the mid price of the entire position. In contrast, brokers often evaluate individual legs using the Last trade price. This difference exists because brokerage platforms allow traders to manage legs individually or together.

Option Alpha justifies the use of the mid price as the best representation of a position's value as that represents a likely exit price, making it a more accurate measure of its potential value. By avoiding reliance on the Last trade price of any one leg, Option Alpha ensures that individual leg prices don't throw off the overall evaluation.

#### **Wash Sale Rule and Accounting Methods**

Broker statements might reflect the [Wash Sale rule](https://optionalpha.com/learn/stock-wash-sale) in effect, which disallows the immediate repurchase of a security after selling it at a loss for tax purposes. This can lead to variations in P/L calculations between Option Alpha and brokerage platforms.

#### **Exclusion of Commissions and Fees**

Option Alpha does not include any commission or exchange fees in its P/L calculations. This approach simplifies the assessment of a position's performance and allows traders to focus solely on the market movement impact. Although generally only a few cents per trade, exchange and transactional fees can add up over time and create a noticeable difference when comparing P/L.

Each broker has their own fee schedule, which you can reference for an overview of any associated fees.

#### **Understanding the Change Column**

On the Bots homepage of Option Alpha, the Change column represents the change in a position's value from one day to the next. It does not reflect the actual value of the position. For example, if a position’s value was $100 at market close yesterday and is now valued at $200, the Change column will display the difference, which is $100.\
\
This is not the same as a Day P/L or Open P/L column that you may see on the broker platform, which is showing you the value of positions today only, and not the day-to-day change.\
\
Additionally, the Change column from the main Bots page will include the Change of any closed positions today. This makes it common for the two Change column values to be different from one another. One viewpoint reflects all change, including closed positions, the other is only active open positions.

#### **After hours pricing**

The most common discrepancy is caused by after-hours pricing. When the market closes, the spread prices of the underlying position widen out, which causes wild misrepresentations of the position's value. Upon the market reopening the following day, the values, and underlying spreads come back into normal alignment. If you are looking at positions outside of normal market hours, do not be alarmed if your position value is not what you expect.

#### **Overridden Positions**

As mentioned in our[ Order Handling](https://docs.optionalpha.com/platform-1/order-handling) page, the most common reason for differences between the two platforms is due to overridden In The Money positions that were released before expiration by our Option Expiration Protocol. Be sure to keep an eye on your expiring positions and if you intend to let In The Money positions expire, update the closed value based on the settlement price reflected in your brokerage account.


# Decision Properties

Security object details and the various properties used to create decisions.

## Decision Properties

### **Overview**

[Decision recipes](https://docs.optionalpha.com/platform/bots/decisions) evaluate the properties of an underlying security object, which is simply a JSON object that houses the most current information about the underlying or option contract at the moment it's requested.

With few exceptions, the values of the security object for each underlying are updated in real-time, usually multiple times per second (actual update rate is dictated by the market).

#### Example security object:

```
{
  symbol: "SPY",
  description: "SPDR S&P 500 ETF Trust",
  stype: "etf",
  bidSize: 32,
  askSize: 2,
  bidTime: 1619119779000,
  askTime: 1619119779000,
  bid: 412.05,
  ask: 412.06,
  open: 415.89,
  high: 416.78,
  low: 411.13,
  close: 416.07,
  last: 412.0513,
  volume: 76149629,
  size: 0,
  time: 1619119779756,
  ivr: 7.023555,
  ...
  lastUpdate: "0.12s"
}
```

### Security Properties

Aside from IV Rank, which is calculated and cached once daily, the following properties are calculated in real-time:

<table data-header-hidden><thead><tr><th width="182">Property</th><th>Description</th></tr></thead><tbody><tr><td>Property</td><td>Description</td></tr><tr><td>Last Price</td><td>The last traded price of the security</td></tr><tr><td>Close Price</td><td>The most recent market session's closing price</td></tr><tr><td>Open Price</td><td>Current session's open price</td></tr><tr><td>Low Price</td><td>Current session's low price</td></tr><tr><td>High Price</td><td>Current session's high price</td></tr><tr><td>Mark Price</td><td>Current mark price of the security, mid-price of bid/ask.</td></tr><tr><td>Change</td><td>Dollar change from previous session's close and the last price.</td></tr><tr><td>Change %</td><td>Dollar change written as a decimal percentage.</td></tr><tr><td>Volume</td><td>Current session's volume since start of trading (includes pre-market).</td></tr><tr><td>IV Rank</td><td>The Implied Volatility (IV) of the security over the last 52 weeks.</td></tr><tr><td>Greeks</td><td>Delta, Gamma, Theta, and Vega are all real-time data.</td></tr></tbody></table>

{% hint style="info" %}
The Security Object for position leg properties stores value in a decimal type format. When referencing the position leg change or change % this will need to be expressed as a decimal. Therefore, a 100% change in the position leg value is represented as 1.00
{% endhint %}

### Option Leg Properties <a href="#option-leg-properties" id="option-leg-properties"></a>

[**Extrinsic Value**](https://optionalpha.com/options/options-pricing#extrinsic-value) is the difference between the price of an option (or the premium) and that option's intrinsic value. It is comprised of the greek values theta and vega.

[**Intrinsic Value**](https://optionalpha.com/options/options-pricing#intrinsic-value) is the inherent worth of an option. Intrinsic value is indicated by the degree to which the option is in-the-money. It is the difference between the underlying security's price and the options strike price when the option is in-the-money.

[**Chance of ITM**](https://docs.optionalpha.com/calculations/probability) is the mathematical probability of the underlying being in-the-money at expiration.

[**OTM amount**](https://optionalpha.com/blog/the-ultimate-guide-to-option-moneyness) measures the distance between the underlying at its current price and the strike price. It indicates how many points (dollars) away the underlying is from being ITM. If the leg is ITM, then the OTM amount will be 0.

### &#x20; <a href="#overview" id="overview"></a>


# Decision Calculations

Overview of the calculations used by decision recipes to determine position value.

## Decision Calculations

#### **Rate of Return Calculation** <a href="#rate-of-return" id="rate-of-return"></a>

Rate of return is always calculated as max profit / max loss for all position types, where max loss is defined as the theoretical risk less any premium received.

```
Assume a credit spread where strike width = $2.00 and credit = $0.50, then

Max profit = 0.5
Max risk = 2.00 - 0.5 = 1.5

Rate of return = 0.5 / 1.5 = 33%
```

#### % Premium Calculation <a href="#percent-premium" id="percent-premium"></a>

The formula for % premium increase/decreased is:

$$
change\_{percent} = \frac {change} {price\_{open}}
$$

where$$change\_{percent}$$is equal to the net `change` in position value divided by the `openPrice` of the position, defined as:

```javascript
let {openPrice, markClose} = position;
let change = markClose - openPrice;
let changePct = change / openPrice * 100;
```

The definition for `markClose` calculations of individual position types can be found [here](https://docs.optionalpha.com/calculations/broken-reference).

#### **Return % Calculation** <a href="#return-calculation" id="return-calculation"></a>

```javascript
let {priceChange, openPrice} = position;
let returnPct = priceChange && openPrice ? priceChange / openPrice : 0;

//where priceChange = position.currentPrice - position.openPrice;
```

Percentage return measures the percentage gain or loss on an asset or portfolio relative to its starting value.

In the example above, the investor earned a $1,250 total dollar return on a $5,000 investment. To calculate the total return in percentage, simply divide the total gains ($1,250) by the starting value ($5,000) = 25%.

<figure><img src="https://cdn.prod.website-files.com/5fba23eb8789c3c7fcfb5f31/67056a07e53311e0da1d60e0_60d3bc7d4410c25409e7ef89_1091622_PercentageReturn_062321.jpeg" alt="Percentage return formula"><figcaption></figcaption></figure>

Total percent return can be a better indicator of return on investment because it shows growth relative to the initial investment.

#### Total P/L

The sum of open and closed P/L.

#### Total P/L %

The total P/L divided by the bot allocation.

#### Day P/L

The current intraday total P/L minus the previous days closing P/L value or $0 if no previous day.

#### Day P/L %

The day P/L divided by the previous day's closing net liquid or bot allocation if no previous day.

#### Closed P/L

The bot's P/L for all closed positions.

#### Win Rate

The bot's percentage of winning trades. Win Rate (win%) = number of wins divided by total number of closed trades.


# Parameter Selection

Technical explanations on how calculated input parameters are chosen.

## Parameter Selection

Unless otherwise specified, the bots will default to whichever value or parameter is **closest** to the requested input parameter (described below). In almost all cases, this is done by a binary search on a sorted array of possible values.

Additionally, strike selections for **exactly**, **or higher**, and **or lower** are available which provides full control over targeting specific strikes and rounding in your preferred direction based on the strike selection method.

### Strikes Selection

#### Delta

If the user requests a strike based on a delta value, the strike chosen will be the strike with a delta value closest to the delta specified, determined by absolute difference with up to 8 decimal places of precision.

In the simplest case, assume a put option delta ***z*** is chosen with a value ***z*** =−0.1

(i.e., the 10-delta). If the strikes closest to ***z*** have delta values ***x*** =−0.08 and **y**=−0.11, then we choose the strike **closest to** *z* with delta *k.*

Therefore,

<figure><img src="https://cdn.prod.website-files.com/5fba23eb8789c3c7fcfb5f31/6238a31d7476389391357ad9_Delta%20Formula.png" alt=""><figcaption></figcaption></figure>

where ***x*** and ***y*** are identified from the ordered list of all strikes on a given expiration. As noted above, decimal precision goes out to 8 decimal places. The probability that 2 adjacent strikes exist of equal absolute distance to the chosen ***z*** is extremely small. Should that situation occur, the strike chosen will be the first closest to be identified.

The range of deltas listed on the auto-trading platform is in increments of +/- .05. This is because deltas between different tickers are wide-ranging and often have an inconsistent variance. While the bot can choose any delta, the selection of deltas for the bot will be in increments of +/- .0&#x35;**.**

#### Percentage

If a user requests a strike based on percentage value, the strike chosen will be the strike closest to the percentage offset; whether that is a percentage from underlying price or a percentage above or below a referenced leg, it will always be closest to. If choosing a percentage of a referenced leg, the strike chosen will never be the same as the referenced leg, even if the offered strike widths are wider than the resulting percentage offset.

#### Dollar-based

If a user requests a strike based on a dollar-based offset, the strike chosen will be the closest strike to the dollar-based offset. In situations where the width of the offered strikes in an option chain is wider than the specified offset, the next available strike will be selected. The automation will not choose the same strike as the strike in reference.

#### Standard Deviation

The standard deviation option for strike selection compares the current price to the underlying's 30-day std deviation, multiplied by the user-defined value.

Contract expiration does not play a role in the std. deviation calculation: underlying Price +/- (X \* sd30)

***X*** represents the number of std. dev provided by the user.

#### Days to Expiration

**When using "at least" or "exactly"**

When selecting an option expiration using "at least" a certain number of days, the chosen expiration will always be at least the number of days specified but the closest DTE beyond that minimum threshold.

When selecting an option expiration using "exactly" a certain number of days, the chosen expiration will always be the exact number of days specified unless that expiration is not available. In that case, an error will generate notifying that no expiration exists.

**When using between "x and y" days**

When selecting an expiration between "x and y" number of days, the bot will select the first available expiration that is closest to the minimum number of days. For example, if you select an expiration between 10 and 30 days, and there is an expiration at 14 days and another at 21 days, it will choose the 14-day expiration. The bot has a tendency towards the lower bound of the range and will always select the one closest to the earliest day specified.

**When using "on or after a certain date"**

When selecting an expiration on or after a certain date, the expiration chosen will be on that date if an expiration exists, and the closest expiration after that date if it does not exist.

<br>


# Probability

Probability and chance are used synonymously. Any decision recipes describing the probability or chance of something happening will be calculated by the probability formula described here.

## Probability

The bots assume the [Black-Scholes-Merton (BSM)](https://optionalpha.com/topics/options-pricing) model when calculating probability, which (imperfectly) implies a Gaussian or normal distribution. The bots use a fast polynomial approximation for calculating the probability that's derived from BSM.

### Background

The payoff to a European call option, for example, with a strike price ***K*** at the maturity date ***T*** is

$$
c(T)=max\[S(T)−K,0]
$$

where ***S(T)*** is the price of the underlying asset at the maturity date. At maturity, if ***S(T) > K*** the option to buy the underlying at ***K*** can be exercised and the underlying asset immediately sold for ***S(T)*** to give a net payoff of ***S(T) − K***. Since the option gives only the right and not the obligation to buy the underlying asset, the option to buy the underlying will not be exercised if doing so would lead to a loss, ***S(T) − K <0***. The BSM formula for the price of the call option at date ***t=0*** prior to maturity is given by

$$
c(0)=S(0)N(d1)−e−rtKN(d2)
$$

where ***N(d)*** is the **cumulative probability distribution** for a variable with a **standard normal distribution** with a mean of zero and a standard deviation of one. It is the area under the standard normal density function from **−∞** to ***d*** and therefore gives the probability that a random draw from the standard normal distribution will have a value less than or equal to d. Therefore, we have ***0 ≤ N(d) ≤ 1*** with ***N(−∞) = 0, N(0) = 0.5***, and ***N(0) = 0.5***. The term r is the continuously compounded risk-free rate of interest, and variables ***d1*** and ***d2*** must satisfy the respective constraints

$$
d1=ln⁡(SK)+(r+σ22)TσT
$$

$$
d\_1 = \frac{{\ln \left( \frac{S}{K} \right) + \left( r + \frac{\sigma^2}{2} \right) T}}{\sigma \sqrt{T}}
$$

$$
d2=d1−σT
$$

where:\
‍\
\&#xNAN;***S*** = Spot price of the underlying asset\
\&#xNAN;***K*** = Strike price of the option\
\&#xNAN;***r*** = Risk-free rate\
\&#xNAN;***σ*** = Volatility of the underlying asset\
\&#xNAN;***T*** = Time to expiration of the option

For more information on the BSM model, see [here](https://www.jstor.org/stable/1831029).

### Polynomial Approximation

The cumulative standard normal distribution is the probability that a number arising from a standard normal distribution lies between **−∞** and **x**. The cumulative standard normal distribution function, which we'll call ***P(x)***, does not have a simple (read fast, in computing terms) analytical solution. Instead, the bots use a **polynomial or rational approximation** of the standard normal ([26.2.17; National Bureau of Standards, 1972](https://www.math.ubc.ca/~cbm/aands/page_932.htm)). The equation is:

$$
P(x)=1−Z(x)(b1t+b2t2+b3t3+b4t4+b5t5)+ϵ
$$

where,

* ***Z(x)*** is the probability density function for a standard normal distribution, described below

$$
t = \frac{1}{1+px}
$$

*with **p=0.2316419***

* ***b1= 0.319381530***
* ***b2= −0.356563782***
* ***b3= 1.781477937***
* ***b4= −1.821255978***
* ***b5=1.330274429***
* and ϵ is the error estimating ***P(x)***

The equation is valid for:

$$
|e(x)| < 7.5 \* 10^{-8}
$$

This function does not describe the probability of observing value ***x***, but the probability of observing any value **≤x**. As a result, the cumulative normal distribution function is sometimes described as a normal integral function.

The **probability density function**, ***Z(x)***, is equivalent to the slope of the cumulative distribution - in other words, the rate of increase of ***P*** for a given ***x***.

{% hint style="info" %}
The BSM analog for the rational approximation *P(x)* is *N(d)*, described above.
{% endhint %}

The normal probability density function is often confused with the normal distribution function, or is assumed to provide the probability of observing some value, x. In fact, this function only approximates the probability of observing a value within a very small range about x. As a result, when considered over a finite interval, that value can be very much greater than 1, which a probability, by definition, cannot exceed. The function can be described as:

$$
Z(x) = \frac {e^{\frac {-(x-μ)^{2}} {2σ^{2}}}}{σ \sqrt{2\pi}}
$$

where μ is the [location parameter](https://www.itl.nist.gov/div898/handbook/eda/section3/eda364.htm) and σ is the [scale parameter](https://www.itl.nist.gov/div898/handbook/eda/section3/eda364.htm). The case where μ=0 and σ=1 is called the **standard normal distribution**. We can therefore simplify the equation for the standard normal distribution.

$$
Z(x) = \frac {e^{\frac {-x^{2}} {2}}}{\sqrt{2\pi}}
$$

### Probability of Future Price

Bot automations may contain various decisions surrounding the probability of the underlying's price being a specific value at some date in the future. All of these recipes are derived from the same probability formula, P(x).

The probability function takes the current price, strike price, annual volatility of the underlying, the risk-free rate, and days to maturity as inputs to calculate d1 and d&#x32;***​***, as described above. The bots will then effectively calculate N(d2) from BSM by first solving the **probability density function**, Z(x), before using all values as inputs to the **cumulative probability distribution function**, P(x).

The outputs of P(x) and Z(x) are then used to solve a variety of sub-problems relevant to the specific decision recipes: probability above price x, below price x, between prices x and y, etc.

In the context of the BSM, N(d1) and N(d2) represent cumulative standard normal distribution functions applied to d1 and d2 variables, respectively. Even though both d1 and d2 are derived from underlying asset dynamics, volatility, risk-free rate, and time to expiration, they serve distinctly different purposes. It's important to understand why.

#### Role of N(d1)

*N(d1)* serves multiple purposes:

1\. **Delta:** For a European call option, *N(d1)* is the option's Delta, which signifies the rate of change of option price with respect to the price of the underlying asset.\
\
2\. **Hedge Ratio:** N(d1) also represents the number of shares needed to hedge against the price change in the option, often termed as the hedge ratio.

3\. **Probabilistic Interpretation:** N(d1) can be interpreted as the risk-adjusted probability that the option will finish in-the-money under the risk-neutral measure, discounted back to today's value.

#### Role of N(d2)

N(d2), on the other hand, has a more specific role:

1\. **Probabilistic Interpretation:** N(d2) represents the risk-neutral probability that the option will be exercised, i.e., that the asset will be above the strike price K at expiration T for a call option.

2\. **Link to Option Price:** N(d2) is directly used in the Black-Scholes formula to determine the value of a European call option as:

$$
C = S \cdot N(d\_1) - K \cdot e^{-rT} \cdot N(d\_2)
$$

and similarly for a European put option as:

$$
P = K \cdot e^{-rT} \cdot (1-N(d\_2)) - S \cdot (1-N(d\_1))
$$

#### Key Differences

1\. **Sensitivities:** N(d1) is more sensitive to changes in the underlying asset's price, given its direct correlation to Delta. N(d2) is generally less sensitive to these changes.\
\
2\. **Functional Role:** N(d1) has a broader set of implications, including hedge ratios and option sensitivities. N(d2) is primarily used for pricing and probabilistic assessment related to the strike price.

3\. **Mathematical Derivation:** d1 and d2 may appear similar, but the minor difference in the terms (presence or absence of σ22) significantly impacts their role in option pricing and risk management.

#### How to Interpret N(d1) and N(d2) in Trading

N(d1) can be viewed as the risk-adjusted probability that the option will be exercised, assuming the option is held until expiration and that returns are log-normally distributed. In the context of the Black-Scholes model, this risk adjustment is performed via a drift term equal to the risk-free rate r, implying a risk-neutral valuation.

Mathematically, N(d1) can be considered the delta of an option, i.e., the sensitivity of the option's price with respect to a change in the price of the underlying asset.

N(d2), on the other hand, is the risk-neutral probability that the option will be exercised, without any further adjustments. This is more straightforward than N(d1) and essentially represents the probability that the option will end up in-the-money under the risk-neutral measure.

In simpler terms, N(d2) represents the probability that the option will be exercised in a world where all investors are risk-neutral.

While both N(d1) and N(d2) are derived from the same Black-Scholes formula, their financial interpretations are markedly different. N(d1) serves as the risk-adjusted (via risk-free rate) probability for the option ending up in-the-money, whereas N(d2) represents the risk-neutral probability of the same. Both are crucial for understanding the behavior and valuation of options within the Black-Scholes framework.

### Probability Decisions on the Underlying

There are several probability-related decisions available when analyzing the security object. Examples include:

* Chance of being above/below m price in n days is more/less than x.
* Chance of being between a and b prices in n days is more/less than x.

Both decisions use variations of fast polynomial approximation to calculate the final probability of the event occurring. The first use case, the chance of being **below** m price in n days, is the output of P(x). The opposite decision, the chance of being **above** m price in n days, is simply 1−P(x).

In the case of price between prices a and b, recall that the cumulative standard normal distribution polynomial describes the probability of observing any value ≤x. Therefore, to calculate the chance of falling within a range in n days, we subtract P(x) with S(T)=a from P(x) with S(T)=b to determine the final probability.

### Probability Decisions on the Opportunity

There is one probability-related decision available when analyzing Opportunities, either in a decision or as part of Trade Ideas:

* Chance of *Profit, MaxProfit, MaxLoss, ITM, etc.* is more/less than x.

Unsurprisingly, we are again calculating the probability of ending up at some price in the future. The only relevant question is, which price and when? For Opportunities, calculations are always made using the number of days to expiration as the input, i.e., we're answering the question, "What is the chance of these things happening *at expiration*?"

The determination of underlying price in relation to profit, max loss, or being ITM is fully dependent on both the strategy type in question and the composite value of the opportunity, given its individual legs (assuming an options strategy).

In the case of a short put spread, for example, the "chance of profit" is determined by the probability the underlying price will be above the break-even price of the spread at expiration. In other words, the probability the spread will make at least a $1 profit. The max loss chance is then determined by the underlying price being below the long put at expiration, and the being ITM chance is determined by the underlying price being below the short strike at expiration.

The same principles are applied to each strategy type. In the case of more complex, multi-legged strategies like iron condors, we use the same probability formula for calculating the chance of price between prices a and b to determine the likelihood of the profit range in between the short strikes, max loss range, etc.


# Probability Theory

Implied volatility (IV) and historical volatility (HV) are essential measures in probability theory. Learn why Option Alpha uses HV for calculating the probability of a future price.

## Probability Theory

[Implied volatility](https://optionalpha.com/learn/implied-volatility) (IV) and [historical volatility](https://optionalpha.com/learn/historical-volatility) (HV) stand as two primary measures employed in the domain of probability theory, each with its strengths and limitations. While IV is widely used and quoted, HV offers a more grounded and accurate choice for calculating the probability of future price.

In this article, we will explore the technical nuances and mathematical foundations behind this assertion, examine specific algorithms, methodologies, and concepts used in advanced probability theory and financial modeling.

### How Option Alpha Calculates the Probability of Future Price

If you've been around OA before, you already know that math and probabilities encompass a large part of how we trade. If interested, we have entire articles explaining the gritty details of how [probability is calculated](https://optionalpha.com/help/calculating-probability) and [how we generate true Expected Value](https://optionalpha.com/help/understanding-alpha-and-expected-value) from defined-risk trades. But in short, we use the probability distribution derived from [Black-Scholes](https://optionalpha.com/learn/black-scholes-model) that describes the chance of the underlying stock price being below a target price level at some point in the future.

The inputs to that function are: the current underlying price, target strike price, days to maturity, risk-free rate, and volatility.

The volatility parameter is what I'd like to focus on. We use annualized volatility of the underlying as the volatility input to the equation, specifically the annualized 30-day standard deviation of returns, and it's important to understand why. IV has its place, but it's not entirely relevant to the problem we're trying to solve here. Recall that IV is solved for as the missing variable when reversing the option pricing equation, BSM or similar. But that IV is representative of a *single* option contract.

In [Trade Ideas](https://optionalpha.com/blog/find-better-trade-ideas), for example, the Probability of Profit (POP) for an Iron Condor trade is the probability that the underlying price falls within the breakevens at expiration. An Iron Condor has 4 legs. The cumulative probability function has 1 input for volatility. So what do we do?

We are trying to figure out where the *underlying price* will be in the future, which means the IV of a single option leg won't help us. We could find some average of the individual legs' IVs, roll our own IV calculation that represents the underlying, rely on a black-box proprietary calculation for underlying IV, or use the annualized historical volatility, which is what we choose to do.

{% hint style="info" %}
Assume in this article that Probability of Profit (POP) algorithms refers to a mathematically robust representation of probability calculation that is not simply a function or restatement of a Reward/Risk ratio.
{% endhint %}

### Historical Volatility in Probability Equations

In POP algorithms, historical volatility is used instead of implied volatility to calculate the likelihood of profit. HV, representing the standard deviation of an asset's historical returns, offers a more accurate and predictive measure of the cumulative density area due to its reflection of actual price movements.

Since HV captures the realized price fluctuations of the underlying asset, and by incorporating HV into the POP calculation, we consider the complete historical distribution of the asset's returns. This comprehensive view enables a more accurate assessment of the likelihood that the underlying price will remain within the desired range based on its observed behavior over time.

The use of HV is a practical choice. It ensures that the full range of price movements observed in the past is taken into account. Consequently, a more representative and precise estimation of the likelihood of the underlying price falling within the desired range is achieved.

In "Index Option Prices and Stock Market Momentum," [Amin, Coval, Seyhun (2004)](https://www.jstor.org/stable/10.1086/422440) examined the performance of HV and IV in options pricing and aimed to "test the prediction of standard option pricing models." They posited "that there should be no relation between option prices and past stock market movements." However,

{% hint style="info" %}
"... evidence suggests that taking past stock returns into account results in more-accurate estimates of implied volatilities from index option prices, which have been used by many authors to explore arbitrage opportunities, measure risk premia in the stock markets, or **forecast future volatilities**."
{% endhint %}

The findings of the study revealed that incorporating HV as a measure of volatility led to more accurate pricing models and improved estimations of probabilities compared to using IV. HV captured the historical distribution of price movements, which provided a more complete view of the underlying asset's behavior and better reflected market dynamics. The researchers concluded that HV-based probability calculations resulted in superior predictions and a more reliable assessment of option prices.

#### **Advantages of Historical Volatility**

**Incorporation of actual price movement.** Historical volatility directly incorporates observed price movements and variations over time. This comprehensive view captures the impact of market conditions, shocks, and other factors on volatility dynamics.

**Analysis of skew and term structure.** HV allows for the direct analysis of the [skew and term structure](https://optionalpha.com/learn/skew) of volatility. We can observe variations in volatility levels across different strike prices and expiration dates, gaining insights into market perceptions of risk.

**Tangible measure of realized volatility.** Historical volatility provides a tangible and reliable measure of realized volatility based on actual price data. It serves as a robust foundation for estimating future volatility.

**Reproducibility.** In a later section we will discuss how deriving a single IV number from a landscape of options chains across expirations can be a very black-box endeavor. Anyone can produce an obscure, proprietary IV with a flurry of marketing material about how, "*Our* IV is better than *their* IV." In fact, there are several popular financial platforms that refuse to reveal or provide information on how their IV is calculated. Go ahead and ask them. What's more difficult is providing something that's truly reproducible and verifiable, and that is something we at OA stand behind.

[**IV typically overstates HV**](https://optionalpha.com/lessons/iv-expected-vs-actual-move)**.** IV is derived from option prices and reflects the market's expectation of future volatility, while HV is based on historical price movements. The options pricing models assume constant volatility, which is unrealistic in practice as market conditions change over time. Additionally, IV includes a risk premium to account for uncertain market conditions or perceived risk of extreme volatility.

HV is based on observed price movements that include both predictable and unpredictable factors, excluding anticipation events that can significantly impact prices. The forward-looking nature and market expectations embedded in IV tend to result in a higher estimate of future volatility compared to the retrospective nature of HV.

### Limitations of Implied Volatility

In contrast, implied volatility is derived from option prices and reflects market expectations, not reality, of future price volatility. Calculated using options pricing models like Black-Scholes or similar, implied volatility is not directly observable and varies across different options and strike prices based on market participants' expectations and sentiment regarding future price movements.

In complex options trades such as iron condors, using IV directly becomes impractical as the probability algorithm requires a single volatility parameter representing the entire underlying asset. However, implied volatility can differ across options and strike prices due to factors such as time to expiration, strike price, supply and demand dynamics, and market sentiment specific to each option.

Incorporating implied volatility into the POP calculation necessitates deriving a single value that represents the overall volatility of the underlying asset. Yet, there is currently no standardized method for combining multiple implied volatilities into such a value accurately.

This single value represents an average or aggregate implied volatility across the selected options, typically encompassing different strike prices and expiration dates. The specific options chosen are based on factors like liquidity and moneyness (in-the-money, at-the-money, out-of-the-money), but regardless of the selection, a heuristic approach is employed.

Here's an overview of the process:<br>

**Option selection.** Choose a representative set of options for the underlying stock. These options should have different strike prices and expiration dates, covering a range of maturities and moneyness levels. Commonly, at-the-money options (where the strike price is close to the current stock price) are included.

**Option price input.** Gather the current market prices of all selected options.

**Implied volatility calculation.** Apply an option pricing model, such as Black-Scholes, to calculate the IV for each option in the selected set. This is done by iteratively adjusting the volatility until the calculated option prices match the market prices. There are several common numerical algorithms used to do this:

* Newton-Raphson method, an iterative root-finding algorithm for solving nonlinear equations.
* Bisection method, a bracketing method to find the root of a function within a specified interval.
* Brent's method, a combination of the above methods that offers robustness and efficiency.<br>

**Weighted average.** Calculate a weighted average of the implied volatilities obtained from the previous step. The weights can be based on various factors, such as option liquidity or market capitalization of the underlying stock. The exact methodology for assigning weights may vary depending on the provider or source of the quoted IV. These methods are usually unadvertised (black box).<br>

**Final IV value.** The resulting weighted average implied volatility is the single IV value quoted for the entire underlying stock.

It's important to note that this single IV value is an approximation and represents the market's overall *expectation* of future volatility for the underlying stock. It provides a concise measure of the aggregate market sentiment for the stock's potential price movements.

Providers of implied volatility data, however, may use different methodologies in selecting options and calculating the weighted average, so the specific details of how the IV is derived are few and there can be a wide variance between sources. Comparing probability numbers between different softwares is never apples-to-apples, and this is why.

Due to this practical limitation, historical volatility is often used as a reasonable substitute in the algorithm for calculating POP. Historical volatility provides a single measure of price fluctuations observed in the past, which can be utilized as a consistent volatility input for the underlying asset in the context of the probability calculation.

#### Peering Beyond the IV

The process of calculating a single implied volatility value for an underlying has potential sources of misrepresentation. There are manipulative market forces at play influencing the price of an option that traders, especially retail traders, may not be aware of. Or, if they are aware of it, have no way to measure.

In the context of the POP equation, relying on the weighted IV can have certain significant drawbacks:

**Simplified representation**. The single IV value of an underlying represents an average or aggregate measure of expected volatility across a range of options. It assumes that volatility is constant across all strike prices and expiration dates, which may not be the case. In reality, volatility can vary depending on the specific option contract and market conditions. By condensing the IV into a single value, certain nuances and variations in implied volatility across different options may be overlooked or abstracted away.<br>

**Limited option sample.** The contracts selected for calculating IV might not capture the full range of available options on the underlying stock. If illiquid or less actively traded options are excluded from the sample, the resulting IV value may not fully reflect the true market sentiment or expectations. Again, this part is not up to or controlled by you, the data consumer.<br>

**Weighting methodology**. The weights assigned to individual options when calculating the weighted average IV can vary depending on the methodology used by different providers or sources. Different weighting schemes can lead to different IV values, potentially biasing the overall representation of volatility.<br>

**Skew and term structure.** Implied volatility can exhibit a [skew or smile pattern](https://optionalpha.com/podcast/ultimate-guide-to-option-skew), where options with different strike prices have different implied volatility levels. This skew reflects the market's perception of potential asymmetric risks. A single IV value may not adequately capture the shape of the skew or the term structure of implied volatility, which could lead to misrepresentation of the underlying volatility dynamics.

**Assumption of constant volatility.** Implied volatility assumes a homogeneous volatility distribution across all strike prices and expiration dates. Variations in volatility across different options can be overlooked, leading to a *simplified* representation of volatility dynamics.

**Supply and demand dynamics**. Market makers and institutional investors, who often trade large volumes of options, can influence the supply and demand for specific option contracts. By actively trading or overtrading options, they can affect the prices and implied volatility levels. This may even be done strategically to impact the IV and potentially benefit their trading positions.<br>

**Volatility positioning.** Market markers may also have an incentive to influence the IV to benefit their trading strategies. For example, if a market maker or a large investor holds a significant position in options, they might take actions that can temporarily affect the supply or demand for those options, thereby impacting the IV.<br>

**False quotes or rumors**. Market participants can spread false quotes or rumors to manipulate perceived market sentiment. This can create artificial demand for options, affecting their prices and subsequently their IV.<br>

**Market maker activities.** Market makers, who facilitate options trading and provide liquidity, have the ability to influence option prices and implied volatility through their trading activities. They adjust their quotes and hedging strategies based on *their* assessment of market conditions, which can not only impact calculated IV, but it is an unwanted inherent bias baked into the IV number.<br>

It's extremely important for retail traders to be aware of these factors and exercise caution when interpreting and relying on implied volatility data. Multiple sources, analysis of option chains, and consideration of broader market factors can provide a more comprehensive view of the underlying volatility dynamics.

### Conclusion

In this article we've discussed the motivations behind the use of Historical Volatility (HV) as the input parameter to Black-Scholes probability instead of the less trustworthy weighted Implied Volatility (IV) of the underlying security.

HV provides a more robust measure of volatility because it considers a broader range of market conditions and price movements over a specified time period. Unlike IV, which can be influenced by short-term market sentiment, HV takes into account a longer time frame, providing a more comprehensive view of volatility dynamics.

This empirical foundation lends credibility to HV as a reliable measure of realized volatility, as it is derived from a large sample size rather than relying on theoretical assumptions or market sentiment.

Since HV is based on readily available historical price data, it remains consistent over time and can be recalculated for any given period. It provides valuable insights into the potential range of price movements and assists in making informed decisions about risk exposure and position sizing. There is practicality and real-world relevance of HV that is simply not present in momentary IV.


# Understanding Alpha and Expected Value

Explore the math behind Expected Value (EV) for defined-risk options trades. We discuss Trade Ideas 2.0's groundbreaking EV-based Alpha metric.

## Understanding Alpha and Expected Value

Expected Value (EV) is a fundamental concept in probability theory that provides insight into the outcome or value of a random variable. To put it simply, EV is a weighted average of all possible outcomes. It serves as a powerful tool for decision-making and risk assessment.

In options trading, calculating the EV of a trade is useful for evaluating its potential profitability. To accurately calculate the expected value for an options trade, we found it critical to assess the probabilities and associated payoffs not just for a single profit/loss scenario, but for *every profit/loss scenario*.

We’re excited to announce that in **Trade Ideas 2.0**, we’ve completely revised the Alpha metric to be based on the true Expected Value of an Opportunity. It is a calculation that no one else in this industry is offering.

To understand how and why, let's explore three levels of increasing difficulty for calculating the expected value of a risk-defined options trade, accompanied by mathematical examples for each step.

{% hint style="info" %}
A model is only as good as its assumptions. For the following examples, we assume all trades are defined-risk, meaning both the maximum profit and loss are known. We also assume there is an efficient function for calculating the probability of the underlying’s price being above or below some price in the future; for this, we will be using the Probability Density Function (PDF) described by Black-Scholes. [Learn more about how Option Alpha calculates probabilities here](https://optionalpha.com/help/calculating-probability).
{% endhint %}

### Calculating EV at Expiration for Max Profit or Loss

The simplest and most often cited method of calculating EV is for maximum profit and loss at expiration. This method is often described using hypothetical scenarios like, “Would you play the game?” E.g., if you won $1 for every coin flip that landed heads and lost $2 for every coin flip that landed tails, would you play the game?

#### **Simple Betting** Games

The options trading analog is to assume that for every “play” of the game (trade taken to expiration), is it worth it to play assuming you took full profit or full loss?

Consider a betting game with a maximum potential profit of $500 and a maximum potential loss of $200. Suppose you estimate the probabilities of reaching the max profit and max loss at expiration to be 40% and 60%, respectively. To calculate simple EV, you multiply each outcome by its probability, P(x), and add them:

$$
EV=(MaxProfit∗P(MaxProfit))+(MaxLoss∗P(MaxLoss))
$$

<figure><img src="https://cdn.prod.website-files.com/5fba23eb8789c3c7fcfb5f31/64a603b8c923669dda417a2c_fC77lCBg_kpa0qjFu2COIqNfEONFAQiTHCGmuBw6d7HI9-SzKkh0AMeKzq5jYtcLRfKwo8p89MJ8vh4jScBRz7Y9BGrQ-_K1XSVF2FnE6m8G_Tr_os7JiCH2RWvoUDFXGTkYwLTGAxlIyaCpKV4QPfw.png" alt=""><figcaption><p>Expected value of a simple betting game with positive outcome</p></figcaption></figure>

Therefore, the expected value of an options trade at expiration, considering only the max profit or max loss scenarios, is $80.

The expected value is not always positive, however. More often than not, EV for betting games is negative when there’s a lower percentage chance of winning a lot of money and a higher percentage chance of losing a little money, e.g., playing the lottery.

Imagine a lottery game where you bet $2 with a 1% chance of winning $100 and a 99% chance of losing $2.

<figure><img src="https://cdn.prod.website-files.com/5fba23eb8789c3c7fcfb5f31/64a72e39ea269acdbb63ea34_Negative%20EV%20Example.png" alt="Negative EV example"><figcaption><p>Expected value of a simple betting game with negative outcome</p></figcaption></figure>

So, over time, you can expect to lose $0.98 every time you play the game.

The problem with this calculation, however, is that options trades are not strictly binary outcomes, and the assumptions used here will usually yield an EV of near zero when real market payoffs and probabilities are used. But there is a gray area beyond the short strikes and before the breakevens where some, but not all, profit can be achieved. This can wildly affect the outcome over many occurrences.

Example:

<figure><img src="https://cdn.prod.website-files.com/5fba23eb8789c3c7fcfb5f31/64a946185b0fb260f936bd39_Expected%20Value%20Calculation.png" alt="Expected Value Calculation Options Trading"><figcaption><p>Profit/Loss diagram of a defined-risk options trade with partial profit region</p></figcaption></figure>

To illustrate, let’s first consider the simplest case where the third possibility, the “gray area,” results in a fixed payout win, rather than a difficult-to-calculate partial win or loss.

### Estimating Expected Value for an Average Outcome

If EV is just the summation of probabilities multiplied by their outcomes, then it stands to reason that the more probabilities and outcomes known, the more accurate the final value will be.

Any time you see options EV quoted or explained in a defined-risk manner where the probabilities sum to 1 while *only* considering the max profit or loss, you can immediately assume that it’s wrong. At best, it’s a broad estimate or generalization.

The probabilities of max profit and loss *can’t* sum to 1 because there is a very real possibility the underlying asset's price is between the strike prices at expiration. In this case, we need to calculate the partial profit or loss.

To address this scenario in an options trade, we can enhance our simple EV calculation by assuming an intermediate payout outcome. This method is commonly employed in some financial software products because it offers a more robust solution while remaining a fast and deterministic calculation for a computer.

The profit is determined by the difference between the net credit received and the difference between the strike prices, multiplied by the probability of the underlying price expiring between the strikes.

The loss is the difference between the net credit received and the difference between the strike prices, multiplied by the complementary probability.

For partial profit/loss, let's first consider the following example of a put credit spread:

Short Put: Strike price $55\
Long Put: Strike price $50\
Premium received: $2.00

Assuming a 70% probability of the stock price staying above $55, a 20% probability of it expiring between $55 and $50, and a 10% probability of it falling below $50, we can calculate the expected value by using a linear approximation for the underlying price within the range between the two strikes.

Here's a simple way to represent the partial profit/loss EV:

1\. **Calculate the Range Value:** The difference between the short put strike and the long put strike: $55−$50=$5.

2\. **Calculate the Net Credit Received:** Given as $2.00 in our example.

3\. **Calculate Max Loss:** The max loss is the difference between the range value and the net credit received, i.e., ($5−$2)=−$3

4\. **Calculate Partial Profit or Loss:** The expected value of the partial profit/loss is the midpoint between the max profit and max loss, multiplied by the probability of the partial range:

$$
Partial = \left(\frac{$2 - $3}{2}\right) = -$0.50
$$

5\. **Calculate the EV:**

$$
EV=(Max Profit∗P(Max Profit))+(Partial∗P(Partial))+(Max Loss∗P(Max Loss))
$$

$$
\= ($2 \* 0.7) + (-$0.50 \* 0.2) + (-$3 \* 0.1)
$$

$$
\= $1.40 - $0.10 - $0.30
$$

$$
\= $1.00
$$

Therefore, the expected value of this short put spread, accounting for estimated partial profit or loss, is $1.00.

This approach offers a reasonable approximation without introducing complexity and can be considered a more balanced estimate of the partial profit range payoff within the given probabilities and constraints. It treats the partial range as a uniform distribution and considers the average of the max profit and max loss to represent this range.

Even though this calculation is objectively better than the “simple” method, it’s still just a broad estimate of EV. Since our goal is to be as accurate as possible, we need something better.

### Calculating Expected Value as a Random Variable

For Trade Ideas 2.0, we decided to use the most mathematically robust representation of Expected Value that we could. The method we employ and its use in an Alpha metric is, to our knowledge, something not seen anywhere else in the industry.

We’re about to dive into some math theory, so buckle up. What we’re trying to accomplish is known as calculating the expected value of a random variable. But there are different methods of solving this problem, and their use is dictated by how the variable is described: continuous or discrete.

* Discrete random variables are countably finite, meaning there is an observable number of increments or steps the value of the variable can be.
* Continuous random variables are uncountably infinite.

#### Continuous Random Variables

A continuous random variable encompasses all real values within a specific range or interval. For instance, it could represent the height of a person or the time required for an event to occur. These are considered continuous because a more granular level of measurement resolution can always be achieved, e.g., a person’s height can always be measured to more decimal places.

Calculating the expected value for continuous random variables involves finding the integral of the product of the variable and its probability density function (PDF) over its entire range.

To determine the expected value, E(X), of a continuous random variable X, the following formula is used:

$$
E(X) = ∫\[x \* f(x)] dx
$$

Here, f(x) represents the Probability Density Function (PDF) of X. By integrating the product of x and its probability density across the range, we arrive at the expected value.

#### Discrete Random Variables

On the other hand, a discrete random variable takes on distinct and specific values. Examples include the number of heads obtained in coin flips or the outcome of a roulette game. In this case, the expected value is calculated by summing the product of *every possible value* and its corresponding probability.

The formula for calculating the expected value, E(X), of a discrete random variable X is:

$$
E(X) = ∑\[x \* P(X=x)]
$$

Here, x represents each possible value of X, and P(X=x) denotes the probability of X taking on that specific value. Recall from your college Calculus class that big sigma, ∑, means summation. By summing the product of each possible value and its probability, we determine the expected value.

This is basically a more formal definition of what we were doing in the previous examples, all of which happen to have discrete outcomes.

#### Underlying Price as a Discrete Random Variable

In options trading, determining EV involves discrete steps due to the incremental nature of potential profits or losses. For example, there are discrete $0.01 steps in the underlying’s price (in most cases) between the upper and lower profit bounds. This means we need to calculate EV based on a discrete random variable, and fortunately, the math to do so is significantly less complicated than continuous variables.

The trade-off, and the reason no one else is doing this at scale, is the higher computational power required to do the summation, which can only be solved at best in linear time. In other words, there are no shortcuts; every discrete outcome and its probability must be calculated within the profit range. The wider the strikes, the larger the profit range, and the more possible discrete outcomes. Multiply that process by millions of Trade Ideas and Opportunities and suddenly you have a big data problem.

To illustrate what we’re talking about, suppose you establish a put credit spread with a short strike price of $50 and a long strike price of $49. The credit spread involves selling an option with a higher strike price and simultaneously buying an option with a lower strike price. The potential payoff at expiration is determined by the underlying asset's price movement relative to the strike prices, and a maximum loss is incurred if the underlying is below the long strike price at expiration. Partial profit (or less than max loss), however, can occur anywhere between the strikes.

To calculate the expected value, we must determine the probabilities and payoffs for each $0.01 discrete increment between $49 and $50. Let's assume the following probabilities are known:

* Probability of stock price above $50 (max profit): P(X>$50)
* Probability of stock price below $49 (max loss): P(X<$49)
* Probability of stock price at each $0.01 increment between $49 and $50 (partial profit):

$$
P(X=$49),P(X=$49.01),P(X=$49.02),...,P(X=$50)
$$

Next, we need to calculate the payout for each outcome. Assume there is a function Z(x) that describes the payout for each outcome x. Now we can multiply each outcome by its corresponding probability, and finally sum the products to create the Expected Value. Our EV equation then becomes:

$$
E(X)=∑\[Z(x)∗P(X=x)]
$$

For outcomes less than $49, the payout is the maximum loss. For outcomes greater than $50, the payout is the maximum profit. And for discrete outcomes between $49 and $50, the payout is a partial profit or loss described by Z(x).

The final equation for calculating the expected value, E(X), in this scenario, can be expressed as:

$$
\small E(X) = Z(Max Loss) \* P(X < $49) + ∑\[Z(Partial) \* P(X = $x)] + Z(Max Profit) \* P(X > $50)
$$

While on its own a single calculation of this formula can be completed fairly easily using commodity computing hardware, nothing is easy at scale. In order to build and rank Trade Ideas, we are computing EV along with many other performance probability metrics for millions of trade setup combinations.

This requires us to rent some truly powerful cloud computing hardware each month. But we chose to do it because we believe this equation provides the most accurate and useful expected value metric available anywhere. That is what Option Alpha traders deserve and it gives us great pride to be able to provide it for you.

### The New Alpha

In Trade Ideas 1.0 we created the notion of Alpha, which was a proprietary value that combined various market metrics and statistics in a unique way to provide a score that identified trading opportunities.

But that Alpha didn’t sit right with us. We want to be in the business of transparency, not opacity, and we don’t want to peddle the illusion that we know something OA traders don’t, or that we’re smarter. We’re not. We’re just traders who use and share the tools we build because we believe there’s a better way to trade options.

In Trade Ideas 2.0, we decided to revise how Alpha is calculated and share it with you all in a completely transparent and reproducible way. Now that the true EV of a trade is known, we simply calculate the Alpha value as the Expected Value divided by the Max Loss - an enhanced version of the Reward/Risk metric.

{% hint style="info" %}
We have published multiple [Research Insights blogs](https://optionalpha.com/category/research-insights) to analyze how pre-trade EV and Alpha values compare to realized P/L results using Trade Ideas positions.
{% endhint %}

### Conclusion

Understanding and calculating the Expected Value in options trading is essential for assessing the potential profitability of a trade.

In this article, we walked through three increasing levels of difficulty for calculating EV, and described how traders can delve into increasingly complex calculations involving probabilities, payoffs, and discrete price increments. The resulting Expected Value provides valuable insights into the average outcome of an options trade.

In Trade Ideas 2.0, we introduced the most robust and computationally heavy calculation for EV to provide traders with the most accurate calculations in the industry, something not seen anywhere else.


# Troubleshooting

Common errors and troubleshooting help to get your bots running smoothly.

## Troubleshooting

{% stepper %}
{% step %}

#### [Testing Automations](/technical-documentation/troubleshooting/testing-automations)

Testing automations enables you to check all the logic and decision criteria to be confident your bots will perform how you anticipate.
{% endstep %}

{% step %}

#### [Broker Rejection Messages](/technical-documentation/troubleshooting/broker-rejection-errors)

Overview of common error messages you may encounter when submitting orders through the autotrading platform.
{% endstep %}

{% step %}

#### [Capital Warnings](/technical-documentation/troubleshooting/capital-warnings)

The “not enough avialable capital” warning occurs when there isn't sufficient capital for a bot to enter a new position.
{% endstep %}

{% step %}

#### [Position Limit Warnings](/technical-documentation/troubleshooting/position-limit-warnings)

Position limit warnings occur when you reach the maximum allowable positions for a bot or the trading day.
{% endstep %}

{% step %}

#### [Trade Enforcements](/technical-documentation/troubleshooting/trade-enforcements)

Learn how to navigate the trade enforcement rules for different strategies.
{% endstep %}

{% step %}

#### [Pricing Anomaly Warning](/technical-documentation/troubleshooting/pricing-anomaly-warning)

The “pricing anomaly” warning occurs when a trade opportunity experiences pricing that is outside of what is expected.
{% endstep %}

{% step %}

#### [Missing or Invalid Input](/technical-documentation/troubleshooting/missing-or-invalid-input)

The “missing input” or “invalid value” error occurs when a required input field is not assigned inside the automation.
{% endstep %}

{% step %}

#### [Daily Symbol Limit Error](/technical-documentation/troubleshooting/daily-symbol-limit-error)

The “daily symbol limit” error occurs when a bot attempts to reference more than 10 symbols in a single trading day.
{% endstep %}

{% step %}

#### [Excessive Errors Failsafe](/technical-documentation/troubleshooting/excessive-errors-failsafe)

The “excessive errors” failsafe occurs when a bot encounters ten errors in one day and automatically turns off automations. Here is what you need to know about excessive errors.
{% endstep %}

{% step %}

#### [Bot Event Loops](/technical-documentation/troubleshooting/bot-event-loops)

Bot event loop errors may occur in positions that are triggered by an open position or close position event.
{% endstep %}

{% step %}

#### [Option & Expiration Availability](/technical-documentation/troubleshooting/option-and-expiration-availability)

Bots notify you with an error or warning if a specific option leg or expiration are not available for your position. Here's why you receive these alerts, and how to avoid them.
{% endstep %}
{% endstepper %}


# Testing Automations

Testing automations enables you to check all the logic and decision criteria to be confident your bots will perform how you anticipate.

## Testing Automations

Testing your bots and automations is a critical step when building your portfolio. Testing allows you to observe how your bot works, diagnose potential issues, and ensure that automations function as you intend.

There are multiple ways to test your bots. We recommend running bots in a paper trading account before using live capital.

We encourage you to continuously test all facets of a bot to feel confident your strategies execute correctly. It is important to test in multiple environments, capital structures, and trading limits.

You can always test any automation type individually by clicking the “**Run Test**” button.

<figure><img src="https://cdn.prod.website-files.com/5fba23eb8789c3c7fcfb5f31/66b267ac843884e2a3d74aed_66b26796f9ba44cc44f3db14_run-test.png" alt=""><figcaption></figcaption></figure>

The test feature allows you to verify the automation’s logic will function the way you expect it to and identify where any issues may occur.

You can choose any bot to run the test in and even assign custom inputs. Testing an automation in different bots lets you view the results for additional capital allocations and position limits.

When testing an automation, live market data is used when evaluating decision recipes. You can view all information immediately in the Automation Log.

<figure><img src="https://cdn.prod.website-files.com/5fba23eb8789c3c7fcfb5f31/66b267ac843884e2a3d74ae9_66b267a39fb92216f2f1379f_test-automation.png" alt=""><figcaption></figcaption></figure>

Testing your bots is also a proactive way to review how different variables affect the bot. For example, changing a technical indicator may determine whether or not a position will be opened or closed at the end of the automation.

{% hint style="info" %}
Remember, this is only running a test inside the bot. Positions will not be opened, and no actions will be visible in the Bot Log. Testing is a great way to verify your bot’s decision-making parameters and outcomes.
{% endhint %}


# Broker Rejection Errors

Overview of common error messages you may encounter when submitting orders through the autotrading platform.

## Broker Rejection Errors

Each [broker](https://optionalpha.com/integrations) will have its own API-generated error message that is sent back to us if an error rejection is encountered on their end. Broker rejection errors can occur from a number of situations, including PDT violation, stepping on strikes, or an incompatible account type.

This page will outline the most common error messages you might encounter when submitting orders on the autotrading platform through your brokers API.

It is important to note that these error messages are returned from the broker and are not generated by Option Alpha or the autotrading platform. Each broker has their own unique error language, that will vary slightly depending on the direction of the rejected trade.

This article is intended to help you determine the root cause for the error message that appears in your canceled order information.<br>

#### Common Broker Errors

[Overlapping or Stepping on Strikes](https://optionalpha.com/help/overlapping-strikes-failsafe)

If a new position order offsets the legs of an existing position, the broker will generate an error to prevent "stepping on" the existing legs. This error will display regardless of whether overlapping strikes occur within a single bot or two separate bots, and the broker does not differentiate between order origination within the same brokerage account.\
\
**Tastytrade** responds: "Order rejected by tastytrade: You cannot sell to open against a long position."

**TradeStation** responds: "Order rejected by TradeStation: EC804: Boxed positions are not permitted. To close long position, try a "Sell" order"

**Tradier** responds: "Order rejected by Tradier: Backoffice rejected override of the order. Unexpected SellShortOrder"

[Duplicate Orders](https://optionalpha.com/help/duplicate-orders-error)

In situations where you have a resting limit order that was created through your brokerage platform and a bot attempts to perform a closing action of its own for the same position, the broker will reject the order.\
\
**Tastytrade** responds: "Order rejected by tastytrade: You already have a closing order for \[symbol] which must be canceled before this order can be routed"

**TradeStation** responds: "Order rejected by TradeStation: EC703: You are long 1.00 shares with 1.00 remaining on sell orders!"

**Tradier** responds: "Order rejected by Tradier: Backoffice rejected override of the order. ShortPositionCrossZero"

[PDT (Pattern Day Trade)](https://optionalpha.com/podcast/pattern-day-trading-rules-for-options)

Pattern Day Trader restrictions are imposed by the brokerage and prevents people with less than $25,000 in their investment accounts from engaging in day trading. If an order violates the PDT rules each broker will respond with their own error and impose the restriction the following day.

**Tastytrade** responds: "Order rejected by tastytrade: Account is set to closing only and this order has an opening leg."

**TradeStation** responds: "Order rejected by TradeStation: EC501: Day trading margin rules, too many opening trades, please call Trade Desk"

**Tradier** responds: "Order rejected by Tradier: Backoffice rejected override of the order. DayTraderPatternRestriction"

**Broker Links**

Additional rejection errors for Tradier can be found [here.](https://documentation.tradier.com/brokerage-api/overview/errors)


# Capital Warnings

The “not enough available capital” warning occurs when there isn't sufficient capital for a bot to enter a new position.

## Capital Warnings

The “Not Enough Available Capital” warning occurs when a trade is attempted and the bot does not have sufficient funds available to cover the position.

Although there may be enough capital allocated to the bot for any single trade, some of that capital may already be in use for other opened trades. See the Capital section of the bot's Dashboard for a description of currently available funds.

<figure><img src="https://2799944806-files.gitbook.io/~/files/v0/b/gitbook-x-prod.appspot.com/o/spaces%2F-MYjluAVRcRcfh1YL43z%2Fuploads%2Fh48sK5dkMoNx2yBIllr5%2F66b26871943baac68502d345_63f921e7172f44017b6c3747_Not20capital.png?alt=media&#x26;token=e31bf80e-e699-438c-985a-aa33e9412658" alt=""><figcaption></figcaption></figure>

You can always edit your bot's allocation in the Safeguards section of the Settings tab.

<figure><img src="https://cdn.prod.website-files.com/5fba23eb8789c3c7fcfb5f31/66b26871943baac68502d337_66b26869a7f877638686ed0b_bot-safeguards.png" alt=""><figcaption></figcaption></figure>

More details on position allocation can be found [here.](https://docs.optionalpha.com/platform-1/automations/automation-behavior)


# Position Limit Warnings

Position limit warnings occur when you reach the maximum allowable positions for a bot or the trading day.

## Position Limit Warnings

Bots have safeguards and limits that alert you when an automation encounters a warning. Daily and total position limits prevent overtrading by limiting the max number of positions a bot can have open at one time and in a single trading day.

### Daily position limit

The daily position limit is the number of positions a bot can open in a single trading day. The “**daily position limit**” warning occurs when a bot attempts to add a position that exceeds the number of new positions allowed.

<figure><img src="https://2799944806-files.gitbook.io/~/files/v0/b/gitbook-x-prod.appspot.com/o/spaces%2F-MYjluAVRcRcfh1YL43z%2Fuploads%2FN2Zo3Ik6bNqdOpzqn7Cj%2F66b2689bd2b1eb0e2ecd835d_63f927c1dba29565a8bccdb2_Daily20limit.png?alt=media&#x26;token=e43f05b9-086e-405c-883a-9f26569afb67" alt=""><figcaption></figcaption></figure>

### Total position limit

The total position limit is the max open positions a bot can have at one time. The “**total position limit**” warning occurs when a bot attempts to add a position that exceeds the maximum number of positions allowed for the bot.

<figure><img src="https://2799944806-files.gitbook.io/~/files/v0/b/gitbook-x-prod.appspot.com/o/spaces%2F-MYjluAVRcRcfh1YL43z%2Fuploads%2FFFpn61DbBYAmPu2oYYVL%2F66b2689bd2b1eb0e2ecd835a_63f927cf205b025fb8960c18_Total20limit.png?alt=media&#x26;token=748cee77-8354-467e-afc0-45570167cb9c" alt=""><figcaption></figcaption></figure>

{% hint style="info" %}
There is no limit on closing positions. Once a daily position limit is reached, the bot won't open new positions unless you edit the safeguards. If a bot is at its max position limit and closes a position, new room becomes available to add a new position, assuming the daily position limit has not been hit.
{% endhint %}

You can always edit your bot's position settings in the Safeguards section of the Settings tab.

<figure><img src="https://cdn.prod.website-files.com/5fba23eb8789c3c7fcfb5f31/66b26871943baac68502d337_66b26869a7f877638686ed0b_bot-safeguards.png" alt=""><figcaption></figcaption></figure>

<figure><img src="https://2799944806-files.gitbook.io/~/files/v0/b/gitbook-x-prod.appspot.com/o/spaces%2F-MYjluAVRcRcfh1YL43z%2Fuploads%2FFS4llJXT1NflIBrr83hZ%2Fimage.png?alt=media&#x26;token=9dab131f-ce49-4aa1-ab98-0489ff416419" alt=""><figcaption></figcaption></figure>


# Trade Enforcements

Learn how to navigate the trade enforcement rules for different strategies.

## Trade Enforcements

The autotrading platform employs a system of enforcements and safeguards in the form of Warnings and Errors to ensure the platform's stability.

Warnings include Not Enough Capital, Pricing Anomaly, Daily and Total Position Limit, and No Expiration Available. These warnings do not count toward the [Excessive Error Failsafe](https://optionalpha.com/help/excessive-errors-failsafe) limit prior to a bot auto-shutdown.

Errors include Leg Enforcements, Unable to Calculate Quantity, Daily Underlying Symbol Limit, and Broker Rejection errors for Overlapping Strikes, Price Exceeds Strike-Difference, and Options Approval Level among others.

More information on the various warnings and errors you might encounter when using bots can be found inside the Help Center [Troubleshooting ](https://optionalpha.com/docs/troubleshooting)section.

### **Leg Enforcements**

When specifying a type of position to open, the structure of that position will be enforced in accordance with the definition of that position. The auto trading platform will require option legs of a trade to have a structure that reflects the correct structure of that trade type.

#### **Leg Enforcement for Credit and Debit Spreads**

A credit spread (short call spread or short put spread), by definition, is an options trade where the sold leg is at a higher delta than the delta of the leg purchased. And vice versa for a debit spread (long call spread or long put spread) where the leg purchased is at a higher delta than the sold leg. The auto trading platform will not permit you to select a "put credit spread" and structure it as if it were a put debit spread.

<figure><img src="https://2799944806-files.gitbook.io/~/files/v0/b/gitbook-x-prod.appspot.com/o/spaces%2F-MYjluAVRcRcfh1YL43z%2Fuploads%2FtLQZd0L8M1UuJncZXYXb%2Fimage.png?alt=media&#x26;token=ed29701c-a2e8-4c52-9dff-14cdae401063" alt=""><figcaption></figcaption></figure>

#### **Leg Enforcement for Iron Condors**

An Iron Condor is a delta-neutral strategy composed of two credit spreads, one on either side of the underlying price. The width of the iron condor can vary, but the structure will be the same and enforced by the auto trading platform. An Iron Condor will always have 4 different strike prices comprising the entire position. It will not be possible to "buy" an iron condor where the purchased deltas are higher than the sold deltas. The delta sold for both the call and the put will be at a higher respective delta than the deltas of the legs that are purchased.

<figure><img src="https://2799944806-files.gitbook.io/~/files/v0/b/gitbook-x-prod.appspot.com/o/spaces%2F-MYjluAVRcRcfh1YL43z%2Fuploads%2FvMvtYk3kDXvk4JdwzOmx%2Fimage.png?alt=media&#x26;token=b5b630d1-946f-4e2f-8f27-0bf44bd7e594" alt=""><figcaption></figcaption></figure>

#### **Leg Enforcement for Iron Butterflies**

On the other hand, an Iron Butterfly is an options strategy designed to profit from decreasing implied volatility. It is made up of 3 strikes where the butterfly's body is created by selling two options, a call, and a put, of the exact same strike price. The wings are created by buying a call and a put that are a certain distance from the strikes which make up the body of the butterfly. This is key to understanding the auto trading platform's enforcement of strikes. An Iron Butterfly is unique from an Iron Condor in that the Iron Butterfly has two short strikes, one call, and one put, of the exact same delta. Where the Iron Condor has four strikes of any delta.

<figure><img src="https://2799944806-files.gitbook.io/~/files/v0/b/gitbook-x-prod.appspot.com/o/spaces%2F-MYjluAVRcRcfh1YL43z%2Fuploads%2FiZPdwgo5axP4VIBWY5SN%2Fimage.png?alt=media&#x26;token=1dcfba3e-17c5-4b00-8276-75c7345e04ea" alt=""><figcaption></figcaption></figure>

{% hint style="warning" %}
**The Iron Butterfly trade type implies strict enforcement that the middle strikes are equal.**
{% endhint %}

<figure><img src="https://2799944806-files.gitbook.io/~/files/v0/b/gitbook-x-prod.appspot.com/o/spaces%2F-MYjluAVRcRcfh1YL43z%2Fuploads%2FJfOFF9Yc9pNqmwjG3AAv%2Fimage.png?alt=media&#x26;token=bd6f815a-8266-4311-9e34-9cd92a8d3525" alt=""><figcaption></figcaption></figure>

### Unable to find Requested Option Leg

In cases where the option being asked for is not available on the underlying chain, the automation will return an error for Unable to find Requested \[put/call] Option. Typically, this error is thrown when attempting to select the *exactly* offset, and exactly what you have asked for is not available.

**Example:**

**‍**Short Put Spread

Short Put leg = -.50 delta or closest

Long Put leg = $5 below the underlying price **exactly**

Unless the underlying price minus $5 equals the exact value of an available strike an error would be thrown.

<figure><img src="https://2799944806-files.gitbook.io/~/files/v0/b/gitbook-x-prod.appspot.com/o/spaces%2F-MYjluAVRcRcfh1YL43z%2Fuploads%2FOYMn496LJyVj4qniXNn4%2Fimage.png?alt=media&#x26;token=6cbda99e-859c-48ae-9900-005608859598" alt=""><figcaption></figcaption></figure>

### Unable to Calculate Quantity Error

When the quantity is undeterminable or less than one, this error is generated. For example, If a trade inputs 0 for the number of shares in the Open Position action quantity field, the following error message will be thrown as 0 is not a tradeable amount. Additionally, you could see this in situations where an input for the quantity field is not properly saved.

<figure><img src="https://2799944806-files.gitbook.io/~/files/v0/b/gitbook-x-prod.appspot.com/o/spaces%2F-MYjluAVRcRcfh1YL43z%2Fuploads%2FB87yMQQSWe3omLD6EpXn%2Fimage.png?alt=media&#x26;token=d44a23ed-2394-4862-870a-20b74eb0d329" alt=""><figcaption></figcaption></figure>

### No Option Expiration Available Warning

When the bot attempts to open a position and the underlying does not have a contract at the specified expiration, the No Option Available warning will be thrown.

<figure><img src="https://2799944806-files.gitbook.io/~/files/v0/b/gitbook-x-prod.appspot.com/o/spaces%2F-MYjluAVRcRcfh1YL43z%2Fuploads%2FHA81Oc1kPGVM75bu2iHK%2Fimage.png?alt=media&#x26;token=76cfe8c9-a860-4662-81e2-712acc895116" alt=""><figcaption></figcaption></figure>


# Pricing Anomaly Warning

The “pricing anomaly” warning occurs when a trade opportunity experiences pricing that is outside of what is expected.

## Pricing Anomaly Warning

The "Pricing Anomaly" warning appears when a trade opportunity's pricing is outside an expected range. This typically occurs when an option leg is lacking a bid or the bid-ask spread for one leg is inverted with another leg.

For example, the strike closer to the money has a mid/mark price that is less than the leg further out-of-the-money.

You should reference your broker platform's option chain to investigate and check for zero-bid and inverted bid-ask spreads if you receive this warning.

<figure><img src="https://2799944806-files.gitbook.io/~/files/v0/b/gitbook-x-prod.appspot.com/o/spaces%2F-MYjluAVRcRcfh1YL43z%2Fuploads%2FdUfri5JhohjMfwkJIWZO%2F67056a637684a4c59aab4c77_62349a67cb7954582cefb2b8_Price%2520Anomaly.png?alt=media&#x26;token=ada6560e-f3f9-4243-9700-496af3e5b744" alt=""><figcaption></figcaption></figure>

Note that bots reference pricing at the time the order is submitted, so there could be situations where pricing for a particular leg fluctuates faster than what is displayed on the broker's platform.


# Missing or Invalid Input

The “missing input” or “invalid value” error occurs when a required input field is not assigned inside the automation.

## Missing or Invalid Input

When an automation encounters an [input](/tools/bots/inputs) with a missing value or an input that is incorrectly linked, an error alerts you that this input has an invalid, or missing, value.

The most common example of this is when inputs are established outside of a [Symbol Loop or Position Loop](/tools/bots/loops). Each loop supplies a default input for its position or symbol, which is intended to be used throughout the automation when referencing symbol or position, so the two are connected.

If a symbol or position input is used in place of the Loops default action input when the automation processes, it encounters a *position* or *symbol* that does not stem from the loop and can not validate.

In other words, the *position* or *symbol* it is referencing is not valid because it is not married to the loop.

{% hint style="info" %}
When building automations that utilize a position or symbol loop, it's important to remember to establish your Loop before the other decisions and then link any symbol or position value to the default action that is supplied with the loop.
{% endhint %}

The error most commonly occurs when a symbol or position loop has been established and used throughout an automation, and the automation is subsequently modified, thereby breaking the link between the loop and inputs. If you've edited your automation and the input is impacted, you'll need to remove the existing input and re-link it to the loop.

<figure><img src="/files/fMYSeIf8iKvacyTsEVUU" alt=""><figcaption></figcaption></figure>


# Daily Symbol Limit Error

The “daily symbol limit” error occurs when a bot attempts to reference more than 10 symbols in a single trading day.

## Daily Symbol Limit Error

You will receive an error if a bot has more than 10 symbols, regardless of whether those symbols are referenced in a scanner, monitor, or event [automation](https://optionalpha.com/help/automation-basics).

So, whether opening new positions, analyzing conditions, monitoring existing positions, or using a symbol as a custom input, the bot has a maximum allowance of 10 ticker symbols.

If you have more than 10 symbols, an error will generate, the automation will stop, and you'll receive a notification that the bot has exceeded its symbol limit. This safeguard upholds the stability of the platform for all users.

{% hint style="info" %}
The bot references symbols at the beginning of the trading day. If you have 10 symbols assigned to a bot when the market opens, you must wait until after hours to change symbols to avoid the error. You can always add and replace symbols until you reach the limit.
{% endhint %}

<figure><img src="https://2799944806-files.gitbook.io/~/files/v0/b/gitbook-x-prod.appspot.com/o/spaces%2F-MYjluAVRcRcfh1YL43z%2Fuploads%2Fa5A7kxJJWUfX0Zq19wZb%2Fimage.png?alt=media&#x26;token=65ca15f5-092b-4777-9472-f91f2d47d9aa" alt=""><figcaption></figcaption></figure>

<br>


# Excessive Errors Failsafe

The “excessive errors” failsafe occurs when a bot encounters ten errors in one day and automatically turns off automations. Here is what you need to know about excessive errors.

## Excessive Errors Failsafe

Bots have [safeguards](https://optionalpha.com/help/safeguards) that alert you when your automations encounter an error. Errors will show up on the homepage.<br>

The **“excessive errors” failsafe** is a protection that automatically turns off all automations if a bot encounters 10 errors in one day. When a bot hits the 10th automation error in one day, the bot's automations automatically turns off.

<figure><img src="https://2799944806-files.gitbook.io/~/files/v0/b/gitbook-x-prod.appspot.com/o/spaces%2F-MYjluAVRcRcfh1YL43z%2Fuploads%2FCWFx6eGdUnGt71kTadVN%2Fimage.png?alt=media&#x26;token=a2242787-c034-42d9-a510-e1074d5544e5" alt=""><figcaption></figcaption></figure>

You can view the error that triggered the alert by clicking “errors” in the bot dashboard’s activity summary. Errors are also displayed in the bot's log, and the automation log will provide more details.

<figure><img src="https://2799944806-files.gitbook.io/~/files/v0/b/gitbook-x-prod.appspot.com/o/spaces%2F-MYjluAVRcRcfh1YL43z%2Fuploads%2FAgvtuJCqqF7lu2eR55iF%2Fimage.png?alt=media&#x26;token=4bb4b260-2c10-4c9d-8880-b282922de259" alt=""><figcaption></figcaption></figure>

{% hint style="info" %}
If a bot hits the ten error limit in one day, you can always turn automations on again. However, if the bot encounters another error on the same day, the automations will turn off again for excessive errors. The excessive error count resets the next trading day.
{% endhint %}


# Bot Event Loops

Bot event loop errors may occur in positions that are triggered by an open position or close position event.

## Bot Event Loops

Bots have safeguards and limits that alert you when an automation encounters an error. These safeguards were created to protect traders and require you to think critically about your trade setup from entry to exit.

Bot event loops typically occur in bots that run on event triggers. The error can happen if you’re not careful when using open position or close position actions inside an automation.

Bots have [position limits](https://optionalpha.com/help/position-limits) and [capital allocation limits](https://optionalpha.com/help/capital-warnings) for an important reason. The limits prevent the bot from entering a “looping” scenario where it opens and closes positions beyond the limits you’ve set in the bot’s global settings.<br>

“Position opened” triggers tell the bot to run an automation once instantly after the bot opens a position. “Position closed” triggers tell the bot to run an automation as soon as a position is closed.<br>

<figure><img src="https://2799944806-files.gitbook.io/~/files/v0/b/gitbook-x-prod.appspot.com/o/spaces%2F-MYjluAVRcRcfh1YL43z%2Fuploads%2FjWSIafme5haWO77SrzZz%2Fimage.png?alt=media&#x26;token=8e124b78-f361-41cb-b6ce-410508a0d7c3" alt=""><figcaption></figcaption></figure>

Event loops are a unique situation where positions are opened or closed because of related events and subsequently become stuck in a “loop.”

For example, an event could automatically open a position when another is closed. Closing the position could trigger another event that immediately opens a new position, thereby causing the bot to enter and exit positions in an endless loop.

The event loop will cause the bot to reach its daily and/or total position limit.

The bot event loop error is a specific, deliberate error you can encounter if you’re not careful setting up your event automation actions Be sure to always think through the process when creating your bots, and don’t forget to [test your automations](https://optionalpha.com/help/testing-automations) and paper trade to avoid these situations!

<br>


# Option & Expiration Availability

Bots notify you with an error or warning if a specific option leg or expiration are not available for your position. Here's why you receive these alerts, and how to avoid them.

## Option & Expiration Availability

If the option leg or expiration you choose isn't available based on your settings, you'll receive a 'Requested option not found' error or a 'No option expiration available' warning.

For example, if you choose an expiration date that is 'exactly 30 days,' but there are no option contracts available for the underlying security, you'll receive a warning.

<figure><img src="https://2799944806-files.gitbook.io/~/files/v0/b/gitbook-x-prod.appspot.com/o/spaces%2F-MYjluAVRcRcfh1YL43z%2Fuploads%2FohM1RFYVjojRlKlP0Vcp%2Fimage.png?alt=media&#x26;token=335a4efd-ddf3-4ad8-bc74-f4c8a5e4f3fc" alt=""><figcaption></figcaption></figure>

Similarly, when [opening positions](https://optionalpha.com/help/automated-trades), you can specify detailed instructions for each leg, but there may not always be an option contract that meets your criteria.

If you select a specific criteria, such as 'Long call leg is $5 above short call leg **exactly**,' and there's no option contract that fits that description, you'll receive an error.

<figure><img src="https://2799944806-files.gitbook.io/~/files/v0/b/gitbook-x-prod.appspot.com/o/spaces%2F-MYjluAVRcRcfh1YL43z%2Fuploads%2FcpTJQMX6nQnlsYAtuHEQ%2Fimage.png?alt=media&#x26;token=172079ed-d074-4fa8-bd52-1d766377be89" alt=""><figcaption></figcaption></figure>

To avoid these errors and warnings, you can use the 'Opportunity is available' decision recipe to check if the exact position is available. If it's not available, the automation will stop without alerting you. This can help you avoid multiple notifications. Once the position type becomes available, the automation will continue as usual. It's worth noting that more option contracts typically become available as expiration approaches and demand for options increases.

<br>


# Overlapping Strikes Failsafe

The overlapping strikes failsafe prohibits bots from overlapping identical strike prices or splitting apart positions.

The overlapping strikes failsafe prevents bots from opening a position that overlaps another position or splits a position apart. The error occurs if the new position is in the same bot or same brokerage account as the existing position.<br>

An attempt to open a new position that overlaps the strike price of an existing position in the same bot (also known as “leg stomping”) triggers the overlapping strikes failsafe.<br>

This failsafe will only occur if the option contracts have the same underlying symbol, strike price, and expiration date.<br>

For example, “Bot A” has a SPY short put spread expiring March 17th with a $393 short put strike price and a $387 long put strike price.

<figure><img src="https://cdn.prod.website-files.com/5fba23eb8789c3c7fcfb5f31/63fd08c2c8762764823b0dc5_Overlapping%20strike%20prices.png" alt="Bot A position details"><figcaption></figcaption></figure>

If you try to open a new position in "Bot A" with an overlapping contract for either leg, you will receive an alert from your broker in the platform.<br>

For example, you can't open a new SPY position with a March 17th $393 long put because the new order interferes with the existing open contract and the order would “cancel out” the existing $393 short put.

> Only a deliberate closing order can close a position.

The failed position will display an error message stating that the broker would not execute the trade because it would close an existing position.<br>

<figure><img src="https://cdn.prod.website-files.com/5fba23eb8789c3c7fcfb5f31/63fd0f375a45d5eed875dff9_Broker%20rejection%20.png" alt="Overlap position broker rejection"><figcaption></figcaption></figure>

The error position occupies an active position spot in your bot and will count against your total and daily position limits. You must [manually cancel the position](https://optionalpha.com/help/managing-positions) to create space for more positions.

All bots within the Option Alpha platform operate independently. However, if two different bots are connected to the same brokerage account, the broker will alert you to the error.<br>

For example, if “Bot B” tries to open a position with a March 17th $393 long put in the same brokerage account as "Bot A," the broker will reject the order and you will receive an in-app notification.

Although bots do not communicate with one another, the overlapping strikes failsafe prohibits the broker from executing the order because the positions are managed within the same brokerage account.


# Price Exceeds Strike-Difference Error

The price exceeds strike-difference error protects you from overpaying when you manually close a spread position.

The '**price exceeds strike-difference**' error may be sent by the broker if the bot attempts to close a credit spread position with a price that is greater than the spread’s width.

For example, if you have a $5 wide short put spread and send a limit oder through Option Alpha to close the position for more than $5, you might receive an error message.

The close position order is rejected by the broker because credit spreads cannot exceed the strike difference.

> **Important**: While all integrated brokers adhere to the rule of rejecting orders that exceed the spread's width, they may not all send a rejection error to the bot in Option Alpha.

<figure><img src="https://cdn.prod.website-files.com/5fba23eb8789c3c7fcfb5f31/663a571674e363229ec7c070_Price%20Exceeds%20Strike.png" alt=""><figcaption></figcaption></figure>

The position remains open after you receive the error. This failsafe is in place to protect you from overpaying and taking a larger loss than necessary on a spread position.

Again, there is no guarantee it will trigger. We suggest using [Exit Option settings and safeguards](https://optionalpha.com/blog/expanded-smartpricing-settings-control-slippage) to control slippage and help mitigate pricing anomalies.


# Duplicate Orders Error

The duplicate orders error protects you from replicating orders in your bot and brokerage platform.

The Duplicate Orders Error occurs when a resting limit order in your brokerage platform duplicates or contradicts a bot's closing action order for the same position.

<figure><img src="https://cdn.prod.website-files.com/5fba23eb8789c3c7fcfb5f31/63fd00366ac37ee0190f4b77_Duplicat%20order%20rejection.png" alt="Duplicat order rejection"><figcaption></figcaption></figure>

For example, if there is already an order to exit a position, the broker won't accept an additional duplicate order.

To avoid the broker rejection error, it is best to allow bots to manage positions. If you prefer to take control of an active position in your brokerage platform, use the [manual override](https://optionalpha.com/help/managing-positions) to prevent the error when the bot attempts to close the position.


# Invalid Authorization Error

You'll receive an Invalid Authorization Error if you change your broker credentials after authorizing an account.

Each broker associated with your Option Alpha account can have only one set of credentials authorized. These credentials provide access to the accounts linked to that username and password.

If you change your brokerage account settings, password, or authorize a new set of credentials after authorizing an account, the existing authorization will become invalid.<br>

If an account is no longer authorized, any attempts to trade in that account will result in an "Invalid Authorization" error. To avoid this error, it's crucial to authorize only one primary set of credentials. If any changes are made to the connected brokerage account, you must reauthorize the connection on Option Alpha.

<figure><img src="https://cdn.prod.website-files.com/5fba23eb8789c3c7fcfb5f31/641b69730b813e35a59e17d6_Invalid%20Authorization.png" alt=""><figcaption></figcaption></figure>

‍\
If you plan to use multiple accounts at your brokerage, you must contact their support team and group them under one username login. You should then exclusively use this username to avoid any authorization-related errors.


# Indicators

Current indicators on the platform and their source code from TA-Lib: Technical Analysis Library.

The indicators used by the bots are supplied wholly by the vetted open-source library, [TA-Lib](https://ta-lib.org). For the curious, all function definitions and inputs are available in the downloadable source code. The definitions for each indicator may differ slightly from their interpretation in some brokerage platforms. The difference is brokers don't provide the source code - we do.

### Indicator Values

All historical daily indicators in the auto trading platform are cached pre-market based on yesterday's close, which makes an indicator a true N-day indicator.

{% hint style="info" %}
The autotrading platform's indicators are based on a Daily (D) time frame.
{% endhint %}

The *intraday* option on the daily indicator shifts all indicator bars forward, and instead of using the most recent close as the final daily bar, it uses the current market price. This interpretation is more in-line with how a brokerage might display values on its platform.

**Example:** RSI(30) would use the 29 days (N-1) of EOD (end of day) prices, and the 30th value (Nth) would be the intraday price at the time the automation is run.

In contrast, a true intraday indicator would be plotted using an aggregation period, or time-series, of less than 1 day and use a lookback function to match the time series.\
\
**Example:** If you plotted a 30 **period** RSI on a 15-minute chart, your lookback would include the last 30, 15-minute bars.

### IV Rank

Implied Volatility (IV) is the parameter component of an option pricing model, such as the Black-Scholes model, which gives the market price of an option. Implied volatility shows how the marketplace views where volatility should be in the future.

IV Rank is describing how the IV relates to where it has been over the past year (52 weeks) by the formula:

$$
iv\_r = \frac {iv-iv\_{low}(year)}{iv\_{high} (year)-iv\_{low}(year)}
$$

The IV Rank of each security is calculated every morning and cached for use by the bots throughout the day. This data is supplied directly by our data provider. Implied Volatility is derived using the analytical formulas of the Black-Scholes model. Model-free price and implied rates are used as an input parameter to the model.

{% hint style="info" %}
The IVR number produced by the autotrading platform is provided directly by the data provider and may vary from your brokerage platform. This is due to the brokerage making its own proprietary calculations.
{% endhint %}

#### Discrepancies in IVR

Although the IVR calculation is only comprised of 3 data points, you may notice variance between the reported IVR values by the bots, values reported by brokers, or values reported by other volatility sources. The reason why is two-fold.

Recall that implied volatility is not directly observable, and is, therefore, a derived metric usually calculated using a closed-form options pricing model. The biggest unknown is the proprietary pricing model that's being applied to the raw data to derive IV by each IVR source.

There are many pricing models to choose from BSM, Binomial, Trinomial, finite difference, Monte-Carlo, or even the ultra-academic "model-free" methods. Depending on which model is used, the reported implied volatility values will differ. Volatility sources rarely state which model is being used in the calculation.

The primary reason for the difference in calculations is where those black box IV calculations place the high and low IV over the last 52 weeks, or 252 trading days. The IVR reported by the bots uses the high/low implied volatility from the set of all instantaneous IV tracked over the last 252 trading days. In other words, all intraday recorded IV is considered, which yields a much more accurate value for IVR.

In contrast, other sources may use only the daily closing IV value over 252 trading days, then determine the high and low from that data set. It is also possible other sources are using the daily average, the high/low weekly average over 52 weeks, etc.

Unless both the pricing model and the method of high/low determination are known, it is very difficult to compare IVR from different sources.

#### VIX

This compares the current real-time reading of the VIX to the referenced value. The VIX is a real-time market index representing the market’s expectations for volatility over the coming 30 days.

The CBOE VIX index is a benchmark index where expected future volatility is calculated based on put and call option pricing in the S\&P 500 index (SPX options). The VIX index is a 30-day representation of volatility expectations for the S\&P 500.

[More Information on VIX](https://optionalpha.com/topics/market-indicators)

#### Volume

Volume is not a cached N-day indicator and is measured in real-time on a daily basis and displayed as the current day's cumulative volume. This cumulative volume will build throughout the day as more shares or contracts are traded.

#### Std Dev

The standard deviation formula is the [generic mathematical formula](https://en.wikipedia.org/wiki/Standard_deviation) in standard usage, comprised of closing values for the last *n* days. 1 standard deviation on our platform is equivalent to the 30-day standard deviation of the underlying's price.

Standard Deviation can be used as part of the decision recipe for \[Symbol] price \[increased] \[2 std devs] since \[1 day ago]

<figure><img src="https://2799944806-files.gitbook.io/~/files/v0/b/gitbook-x-prod.appspot.com/o/spaces%2F-MYjluAVRcRcfh1YL43z%2Fuploads%2F2oU3qWeuZ3n3olJjFLpr%2F66b26b72a21ddd9c4432abb8_6238bf269e0101151bb1aa9b_Standard20Calculation.png?alt=media&#x26;token=b8e26eb4-113e-4b5a-b5c9-d949b8a217bc" alt=""><figcaption></figcaption></figure>

This decision is asking the following question, what is the 30-day std dev on the underlying? How does the price difference between dates X and Y compare to the sd30? The answer is read as, "The price move during the period in question encompassed the equivalent of 1.00 standard deviations"

#### Technical Signals

The technical indicators found in the Screener and automation decisions offer default technical signals for Buy, Sell, or Neutral states. The table below expands on the default settings and how the various technical states are determined for each indicator.

<figure><img src="https://2799944806-files.gitbook.io/~/files/v0/b/gitbook-x-prod.appspot.com/o/spaces%2F-MYjluAVRcRcfh1YL43z%2Fuploads%2FexcF4fdrvZmYf9l7MNMR%2F66b26b72a21ddd9c4432abb0_6659d6045365899f543790b4_Option20platform20indicators.png?alt=media&#x26;token=4ba12f8d-fcc7-40a8-9f74-d5b43a0e19b8" alt=""><figcaption></figcaption></figure>


# ADX

Overview of the Average Directional Index calculation.

## ADX

**Average Directional Index** - The average directional index (ADX) is a technical analysis indicator used by some traders to determine the strength of a trend. According to the creator Welles Wilder, the trend has strength when ADX is above 25 and the trend is weak or the price is trendless when ADX is below 20. Non-trending values do not necessarily mean the price isn't moving, it very well could be, but the price could also be making a trend change or is too volatile for a clear direction to be present.

ADX is considered a non-directional indicator and registers trend whether the price is going up or down. The default setting is 14 bars, although other time periods can be used to increase or decrease the trend strength reading. ADX is plotted as a single line with values ranging from a low of 0 to a high of 100.

The source code for the ADX function is available [here](https://app.optionalpha.com/ta/ADX.txt).

```
/* 
 * The DM1 (one period) is base on the largest part of
 * today's range that is outside of yesterdays range.
 * 
 * The following 7 cases explain how the +DM and -DM are
 * calculated on one period:
 *
 * Case 1:                       Case 2:
 *    C|                        A|
 *     |                         | C|
 *     | +DM1 = (C-A)           B|  | +DM1 = 0
 *     | -DM1 = 0                   | -DM1 = (B-D)
 * A|  |                           D| 
 *  | D|                    
 * B|
 *
 * Case 3:                       Case 4:
 *    C|                           C|
 *     |                        A|  |
 *     | +DM1 = (C-A)            |  | +DM1 = 0
 *     | -DM1 = 0               B|  | -DM1 = (B-D)
 * A|  |                            | 
 *  |  |                           D|
 * B|  |
 *    D|
 * 
 * Case 5:                      Case 6:
 * A|                           A| C|
 *  | C| +DM1 = 0                |  |  +DM1 = 0
 *  |  | -DM1 = 0                |  |  -DM1 = 0
 *  | D|                         |  |
 * B|                           B| D|
 *
 *
 * Case 7:
 * 
 *    C|
 * A|  |
 *  |  | +DM=0
 * B|  | -DM=0
 *    D|
 *
 * In case 3 and 4, the rule is that the smallest delta between
 * (C-A) and (B-D) determine which of +DM or -DM is zero.
 *
 * In case 7, (C-A) and (B-D) are equal, so both +DM and -DM are
 * zero.
 *
 * The rules remain the same when A=B and C=D (when the highs
 * equal the lows).
 *
 * When calculating the DM over a period > 1, the one-period DM
 * for the desired period are initialy sum. In other word, 
 * for a -DM14, sum the -DM1 for the first 14 days (that's 
 * 13 values because there is no DM for the first day!)
 * Subsequent DM are calculated using the Wilder's
 * smoothing approach:
 * 
 *                                    Previous -DM14
 *  Today's -DM14 = Previous -DM14 -  -------------- + Today's -DM1
 *                                         14
 *
 * (Same thing for +DM14)
 *
 * Calculation of a -DI14 is as follow:
 * 
 *               -DM14
 *     -DI14 =  --------
 *                TR14
 *
 * (Same thing for +DI14)
 *
 * Calculation of the TR14 is:
 *
 *                                   Previous TR14
 *    Today's TR14 = Previous TR14 - -------------- + Today's TR1
 *                                         14
 *
 *    The first TR14 is the summation of the first 14 TR1. See the
 *    TA_TRANGE function on how to calculate the true range.
 *
 * Calculation of the DX14 is:
 *    
 *    diffDI = ABS( (-DI14) - (+DI14) )
 *    sumDI  = (-DI14) + (+DI14)
 *
 *    DX14 = 100 * (diffDI / sumDI)
 *
 * Calculation of the first ADX:
 *
 *    ADX14 = SUM of the first 14 DX
 *
 * Calculation of subsequent ADX:
 *
 *            ((Previous ADX14)*(14-1))+ Today's DX
 *    ADX14 = -------------------------------------
 *                             14
 *
 * Reference:
 *    New Concepts In Technical Trading Systems, J. Welles Wilder Jr
 */
```


# ATR

Overview of the Average True Range calculation.

## ATR

**The Average True Range (ATR)** is a technical indicator of volatility based on the average of a particular set of trading ranges over a defined number of periods. The ATR is the average of the true range for a set of periods. The greatest of one of three ranges is calculated as the true range for a period: the current high minus the current low, the current high minus the previous period’s close, or the current low minus the previous close.

Once the true range is calculated, the average for a set lookback period is taken, typically 14 periods. A decline in ATR indicates a decrease in recent volatility. An increase in ATR indicates an increase in recent volatility.

The source code for the ATR function is available [here](https://app.optionalpha.com/ta/ATR.txt).

```
/* Average True Range is the greatest of the following: 
 *
 *  val1 = distance from today's high to today's low.
 *  val2 = distance from yesterday's close to today's high.
 *  val3 = distance from yesterday's close to today's low.   
 *
 * These value are averaged for the specified period using
 * Wilder method. This method has an unstable period comparable
 * to an Exponential Moving Average (EMA).
 */
```


# BOLLINGER BANDS

Overview of the Bollinger Bands Indictor.

## BOLLINGER BANDS

[Bollinger bands](https://optionalpha.com/analysis/technical-indicators#bollinger-bands) are a chart overlay, volatility indicator that show the upper and lower range of normal price movement based on [standard deviation](https://optionalpha.com/academic/models#standard-deviation).

The centerline of Bollinger bands is typically a 20-day simple moving average. The upper and lower bands are twice the 20-day standard deviation of price above and below the centerline.

Source code for the Bollinger Bands (BBANDS) function is available[ here](https://app.optionalpha.com/ta/BBANDS.txt)

```
/* TA-LIB Copyright (c) 1999-2007, Mario Fortier
 * All rights reserved.
 *
 * Redistribution and use in source and binary forms, with or
 * without modification, are permitted provided that the following
 * conditions are met:
 *
 * - Redistributions of source code must retain the above copyright
 *   notice, this list of conditions and the following disclaimer.
 *
 * - Redistributions in binary form must reproduce the above copyright
 *   notice, this list of conditions and the following disclaimer in
 *   the documentation and/or other materials provided with the
 *   distribution.
 *
 * - Neither name of author nor the names of its contributors
 *   may be used to endorse or promote products derived from this
 *   software without specific prior written permission.
 *
 * THIS SOFTWARE IS PROVIDED BY THE COPYRIGHT HOLDERS AND CONTRIBUTORS
 * ``AS IS'' AND ANY EXPRESS OR IMPLIED WARRANTIES, INCLUDING, BUT NOT
 * LIMITED TO, THE IMPLIED WARRANTIES OF MERCHANTABILITY AND FITNESS
 * FOR A PARTICULAR PURPOSE ARE DISCLAIMED. IN NO EVENT SHALL THE
 * REGENTS OR CONTRIBUTORS BE LIABLE FOR ANY DIRECT, INDIRECT,
 * INCIDENTAL, SPECIAL, EXEMPLARY, OR CONSEQUENTIAL DAMAGES
 * (INCLUDING, BUT NOT LIMITED TO, PROCUREMENT OF SUBSTITUTE GOODS
 * OR SERVICES; LOSS OF USE, DATA, OR PROFITS; OR BUSINESS
 * INTERRUPTION) HOWEVER CAUSED AND ON ANY THEORY OF LIABILITY,
 * WHETHER IN CONTRACT, STRICT LIABILITY, OR TORT (INCLUDING NEGLIGENCE
 * OR OTHERWISE) ARISING IN ANY WAY OUT OF THE USE OF THIS SOFTWARE,
 * EVEN IF ADVISED OF THE POSSIBILITY OF SUCH DAMAGE.
 */

/* List of contributors:
 *
 *  Initial  Name/description
 *  -------------------------------------------------------------------
 *  MF       Mario Fortier
 *  JV       Jesus Viver <324122@cienz.unizar.es>
 *
 *
 * Change history:
 *
 *  MMDDYY BY   Description
 *  -------------------------------------------------------------------
 *  112400 MF   Template creation.
 *  010503 MF   Fix to always use SMA for the STDDEV (Thanks to JV).
 *  052603 MF   Adapt code to compile with .NET Managed C++
 *
 */

/**** START GENCODE SECTION 1 - DO NOT DELETE THIS LINE ****/
/* All code within this section is automatically
 * generated by gen_code. Any modification will be lost
 * next time gen_code is run.
 */
/* Generated */ 
/* Generated */ #if defined( _MANAGED )
/* Generated */    #include "TA-Lib-Core.h"
/* Generated */    #define TA_INTERNAL_ERROR(Id) (RetCode::InternalError)
/* Generated */    namespace TicTacTec { namespace TA { namespace Library {
/* Generated */ #elif defined( _JAVA )
/* Generated */    #include "ta_defs.h"
/* Generated */    #include "ta_java_defs.h"
/* Generated */    #define TA_INTERNAL_ERROR(Id) (RetCode.InternalError)
/* Generated */ #else
/* Generated */    #include <string.h>
/* Generated */    #include <math.h>
/* Generated */    #include "ta_func.h"
/* Generated */ #endif
/* Generated */ 
/* Generated */ #ifndef TA_UTILITY_H
/* Generated */    #include "ta_utility.h"
/* Generated */ #endif
/* Generated */ 
/* Generated */ #ifndef TA_MEMORY_H
/* Generated */    #include "ta_memory.h"
/* Generated */ #endif
/* Generated */ 
/* Generated */ #define TA_PREFIX(x) TA_##x
/* Generated */ #define INPUT_TYPE   double
/* Generated */ 
/* Generated */ #if defined( _MANAGED )
/* Generated */ int Core::BbandsLookback( int           optInTimePeriod, /* From 2 to 100000 */
/* Generated */                         double        optInNbDevUp, /* From TA_REAL_MIN to TA_REAL_MAX */
/* Generated */                         double        optInNbDevDn, /* From TA_REAL_MIN to TA_REAL_MAX */
/* Generated */                         MAType        optInMAType ) /* Generated */ 
/* Generated */ #elif defined( _JAVA )
/* Generated */ public int bbandsLookback( int           optInTimePeriod, /* From 2 to 100000 */
/* Generated */                          double        optInNbDevUp, /* From TA_REAL_MIN to TA_REAL_MAX */
/* Generated */                          double        optInNbDevDn, /* From TA_REAL_MIN to TA_REAL_MAX */
/* Generated */                          MAType        optInMAType ) /* Generated */ 
/* Generated */ #else
/* Generated */ int TA_BBANDS_Lookback( int           optInTimePeriod, /* From 2 to 100000 */
/* Generated */                       double        optInNbDevUp, /* From TA_REAL_MIN to TA_REAL_MAX */
/* Generated */                       double        optInNbDevDn, /* From TA_REAL_MIN to TA_REAL_MAX */
/* Generated */                       TA_MAType     optInMAType ) /* Generated */ 
/* Generated */ #endif
/**** END GENCODE SECTION 1 - DO NOT DELETE THIS LINE ****/
{
   /* insert local variable here */

/**** START GENCODE SECTION 2 - DO NOT DELETE THIS LINE ****/
/* Generated */ #ifndef TA_FUNC_NO_RANGE_CHECK
/* Generated */    /* min/max are checked for optInTimePeriod. */
/* Generated */    if( (int)optInTimePeriod == TA_INTEGER_DEFAULT )
/* Generated */       optInTimePeriod = 5;
/* Generated */    else if( ((int)optInTimePeriod < 2) || ((int)optInTimePeriod > 100000) )
/* Generated */       return -1;
/* Generated */ 
/* Generated */    if( optInNbDevUp == TA_REAL_DEFAULT )
/* Generated */       optInNbDevUp = 2.000000e+0;
/* Generated */    else if( (optInNbDevUp < -3.000000e+37) ||/* Generated */  (optInNbDevUp > 3.000000e+37) )
/* Generated */       return -1;
/* Generated */ 
/* Generated */    if( optInNbDevDn == TA_REAL_DEFAULT )
/* Generated */       optInNbDevDn = 2.000000e+0;
/* Generated */    else if( (optInNbDevDn < -3.000000e+37) ||/* Generated */  (optInNbDevDn > 3.000000e+37) )
/* Generated */       return -1;
/* Generated */ 
/* Generated */    #if !defined(_MANAGED) && !defined(_JAVA)
/* Generated */    if( (int)optInMAType == TA_INTEGER_DEFAULT )
/* Generated */       optInMAType = (TA_MAType)0;
/* Generated */    else if( ((int)optInMAType < 0) || ((int)optInMAType > 8) )
/* Generated */       return -1;
/* Generated */ 
/* Generated */    #endif /* !defined(_MANAGED) && !defined(_JAVA)*/
/* Generated */ #endif /* TA_FUNC_NO_RANGE_CHECK */
/**** END GENCODE SECTION 2 - DO NOT DELETE THIS LINE ****/

   /* insert lookback code here. */
   UNUSED_VARIABLE(optInNbDevUp);
   UNUSED_VARIABLE(optInNbDevDn);

   /* The lookback is driven by the middle band moving average. */
   return LOOKBACK_CALL(MA)( optInTimePeriod, optInMAType );                          
}

/**** START GENCODE SECTION 3 - DO NOT DELETE THIS LINE ****/
/*
 * TA_BBANDS - Bollinger Bands
 * 
 * Input  = double
 * Output = double, double, double
 * 
 * Optional Parameters
 * -------------------
 * optInTimePeriod:(From 2 to 100000)
 *    Number of period
 * 
 * optInNbDevUp:(From TA_REAL_MIN to TA_REAL_MAX)
 *    Deviation multiplier for upper band
 * 
 * optInNbDevDn:(From TA_REAL_MIN to TA_REAL_MAX)
 *    Deviation multiplier for lower band
 * 
 * optInMAType:
 *    Type of Moving Average
 * 
 * 
 */
/* Generated */ 
/* Generated */ #if defined( _MANAGED ) && defined( USE_SUBARRAY )
/* Generated */ enum class Core::RetCode Core::Bbands( int    startIdx,
/* Generated */                                        int    endIdx,
/* Generated */                                        SubArray^    inReal,
/* Generated */                                        int           optInTimePeriod, /* From 2 to 100000 */
/* Generated */                                        double        optInNbDevUp, /* From TA_REAL_MIN to TA_REAL_MAX */
/* Generated */                                        double        optInNbDevDn, /* From TA_REAL_MIN to TA_REAL_MAX */
/* Generated */                                        MAType        optInMAType,
/* Generated */                                        [Out]int%    outBegIdx,
/* Generated */                                        [Out]int%    outNBElement,
/* Generated */                                        cli::array<double>^  outRealUpperBand,
/* Generated */                                        cli::array<double>^  outRealMiddleBand,
/* Generated */                                        cli::array<double>^  outRealLowerBand )
/* Generated */ #elif defined( _MANAGED )
/* Generated */ enum class Core::RetCode Core::Bbands( int    startIdx,
/* Generated */                                        int    endIdx,
/* Generated */                                        cli::array<double>^ inReal,
/* Generated */                                        int           optInTimePeriod, /* From 2 to 100000 */
/* Generated */                                        double        optInNbDevUp, /* From TA_REAL_MIN to TA_REAL_MAX */
/* Generated */                                        double        optInNbDevDn, /* From TA_REAL_MIN to TA_REAL_MAX */
/* Generated */                                        MAType        optInMAType,
/* Generated */                                        [Out]int%    outBegIdx,
/* Generated */                                        [Out]int%    outNBElement,
/* Generated */                                        cli::array<double>^  outRealUpperBand,
/* Generated */                                        cli::array<double>^  outRealMiddleBand,
/* Generated */                                        cli::array<double>^  outRealLowerBand )
/* Generated */ #elif defined( _JAVA )
/* Generated */ public RetCode bbands( int    startIdx,
/* Generated */                        int    endIdx,
/* Generated */                        double       inReal[],
/* Generated */                        int           optInTimePeriod, /* From 2 to 100000 */
/* Generated */                        double        optInNbDevUp, /* From TA_REAL_MIN to TA_REAL_MAX */
/* Generated */                        double        optInNbDevDn, /* From TA_REAL_MIN to TA_REAL_MAX */
/* Generated */                        MAType        optInMAType,
/* Generated */                        MInteger     outBegIdx,
/* Generated */                        MInteger     outNBElement,
/* Generated */                        double        outRealUpperBand[],
/* Generated */                        double        outRealMiddleBand[],
/* Generated */                        double        outRealLowerBand[] )
/* Generated */ #else
/* Generated */ TA_RetCode TA_BBANDS( int    startIdx,
/* Generated */                       int    endIdx,
/* Generated */                       const double inReal[],
/* Generated */                       int           optInTimePeriod, /* From 2 to 100000 */
/* Generated */                       double        optInNbDevUp, /* From TA_REAL_MIN to TA_REAL_MAX */
/* Generated */                       double        optInNbDevDn, /* From TA_REAL_MIN to TA_REAL_MAX */
/* Generated */                       TA_MAType     optInMAType,
/* Generated */                       int          *outBegIdx,
/* Generated */                       int          *outNBElement,
/* Generated */                       double        outRealUpperBand[],
/* Generated */                       double        outRealMiddleBand[],
/* Generated */                       double        outRealLowerBand[] )
/* Generated */ #endif
/**** END GENCODE SECTION 3 - DO NOT DELETE THIS LINE ****/
{
   /* Insert local variables here. */
   ENUM_DECLARATION(RetCode) retCode;
   int i;
   double tempReal, tempReal2;
   ARRAY_REF(tempBuffer1);
   ARRAY_REF(tempBuffer2);

/**** START GENCODE SECTION 4 - DO NOT DELETE THIS LINE ****/
/* Generated */ 
/* Generated */ #ifndef TA_FUNC_NO_RANGE_CHECK
/* Generated */ 
/* Generated */    /* Validate the requested output range. */
/* Generated */    if( startIdx < 0 )
/* Generated */       return ENUM_VALUE(RetCode,TA_OUT_OF_RANGE_START_INDEX,OutOfRangeStartIndex);
/* Generated */    if( (endIdx < 0) || (endIdx < startIdx))
/* Generated */       return ENUM_VALUE(RetCode,TA_OUT_OF_RANGE_END_INDEX,OutOfRangeEndIndex);
/* Generated */ 
/* Generated */    #if !defined(_JAVA)
/* Generated */    if( !inReal ) return ENUM_VALUE(RetCode,TA_BAD_PARAM,BadParam);
/* Generated */    #endif /* !defined(_JAVA)*/
/* Generated */    /* min/max are checked for optInTimePeriod. */
/* Generated */    if( (int)optInTimePeriod == TA_INTEGER_DEFAULT )
/* Generated */       optInTimePeriod = 5;
/* Generated */    else if( ((int)optInTimePeriod < 2) || ((int)optInTimePeriod > 100000) )
/* Generated */       return ENUM_VALUE(RetCode,TA_BAD_PARAM,BadParam);
/* Generated */ 
/* Generated */    if( optInNbDevUp == TA_REAL_DEFAULT )
/* Generated */       optInNbDevUp = 2.000000e+0;
/* Generated */    else if( (optInNbDevUp < -3.000000e+37) ||/* Generated */  (optInNbDevUp > 3.000000e+37) )
/* Generated */       return ENUM_VALUE(RetCode,TA_BAD_PARAM,BadParam);
/* Generated */ 
/* Generated */    if( optInNbDevDn == TA_REAL_DEFAULT )
/* Generated */       optInNbDevDn = 2.000000e+0;
/* Generated */    else if( (optInNbDevDn < -3.000000e+37) ||/* Generated */  (optInNbDevDn > 3.000000e+37) )
/* Generated */       return ENUM_VALUE(RetCode,TA_BAD_PARAM,BadParam);
/* Generated */ 
/* Generated */    #if !defined(_MANAGED) && !defined(_JAVA)
/* Generated */    if( (int)optInMAType == TA_INTEGER_DEFAULT )
/* Generated */       optInMAType = (TA_MAType)0;
/* Generated */    else if( ((int)optInMAType < 0) || ((int)optInMAType > 8) )
/* Generated */       return ENUM_VALUE(RetCode,TA_BAD_PARAM,BadParam);
/* Generated */ 
/* Generated */    #endif /* !defined(_MANAGED) && !defined(_JAVA)*/
/* Generated */    #if !defined(_JAVA)
/* Generated */    if( !outRealUpperBand )
/* Generated */       return ENUM_VALUE(RetCode,TA_BAD_PARAM,BadParam);
/* Generated */ 
/* Generated */    if( !outRealMiddleBand )
/* Generated */       return ENUM_VALUE(RetCode,TA_BAD_PARAM,BadParam);
/* Generated */ 
/* Generated */    if( !outRealLowerBand )
/* Generated */       return ENUM_VALUE(RetCode,TA_BAD_PARAM,BadParam);
/* Generated */ 
/* Generated */    #endif /* !defined(_JAVA) */
/* Generated */ #endif /* TA_FUNC_NO_RANGE_CHECK */
/* Generated */ 
/**** END GENCODE SECTION 4 - DO NOT DELETE THIS LINE ****/

   /* Insert TA function code here. */

   /* Identify TWO temporary buffer among the outputs.
    *
    * These temporary buffers allows to perform the
    * calculation without any memory allocation.
    *
    * Whenever possible, make the tempBuffer1 be the
    * middle band output. This will save one copy operation.
    */
   #if defined(USE_SINGLE_PRECISION_INPUT) || defined( USE_SUBARRAY )
      tempBuffer1 = outRealMiddleBand;
      tempBuffer2 = outRealLowerBand;
   #else
      if( inReal == outRealUpperBand )
      {
         tempBuffer1 = outRealMiddleBand;
         tempBuffer2 = outRealLowerBand;
      }
      else if( inReal == outRealLowerBand )
      {
         tempBuffer1 = outRealMiddleBand;
         tempBuffer2 = outRealUpperBand;
      }
      else if( inReal == outRealMiddleBand )
      {
         tempBuffer1 = outRealLowerBand;
         tempBuffer2 = outRealUpperBand;
      }
      else
      {
         tempBuffer1 = outRealMiddleBand;
         tempBuffer2 = outRealUpperBand;
      }
      /* Check that the caller is not doing tricky things. 
       * (like using the input buffer in two output!)
       */
      if( (tempBuffer1 == inReal) || (tempBuffer2 == inReal) )
         return ENUM_VALUE(RetCode,TA_BAD_PARAM,BadParam);
   #endif


   /* Calculate the middle band, which is a moving average.
    * The other two bands will simply add/substract the
    * standard deviation from this middle band.
    */
   retCode = FUNCTION_CALL(MA)( startIdx, endIdx, inReal,
                                optInTimePeriod, optInMAType,
                                outBegIdx, outNBElement, tempBuffer1 );

   if( (retCode != ENUM_VALUE(RetCode,TA_SUCCESS,Success) ) || ((int)VALUE_HANDLE_DEREF(outNBElement) == 0) )
   {
      VALUE_HANDLE_DEREF_TO_ZERO(outNBElement);
      return retCode;
   }

   /* Calculate the standard deviation into tempBuffer2. */
   if( optInMAType == ENUM_VALUE(MAType,TA_MAType_SMA,Sma) )
   {
      /* A small speed optimization by re-using the
       * already calculated SMA.
       */
       FUNCTION_CALL(INT_stddev_using_precalc_ma)( inReal, tempBuffer1, 
                                                   (int)VALUE_HANDLE_DEREF(outBegIdx), (int)VALUE_HANDLE_DEREF(outNBElement),
                                                   optInTimePeriod, tempBuffer2 );
   }
   else
   {
      /* Calculate the Standard Deviation */
      retCode = FUNCTION_CALL(STDDEV)( (int)VALUE_HANDLE_DEREF(outBegIdx), endIdx, inReal,
                                       optInTimePeriod, 1.0,
                                       outBegIdx, outNBElement, tempBuffer2 );

      if( retCode != ENUM_VALUE(RetCode,TA_SUCCESS,Success) )
      {
         VALUE_HANDLE_DEREF_TO_ZERO(outNBElement);
         return retCode;
      }
   }

   /* Copy the MA calculation into the middle band ouput, unless
    * the calculation was done into it already!
    */
   #if !defined(USE_SINGLE_PRECISION_INPUT)
      if( tempBuffer1 != outRealMiddleBand )
      {
         ARRAY_COPY( outRealMiddleBand, tempBuffer1, VALUE_HANDLE_DEREF(outNBElement) );
      }
   #endif

   /* Now do a tight loop to calculate the upper/lower band at
    * the same time. 
    *
    * All the following 5 loops are doing the same, except there
    * is an attempt to speed optimize by eliminating uneeded
    * multiplication.
    */
   if( optInNbDevUp == optInNbDevDn )
   {
      if(  optInNbDevUp == 1.0 )
      {
         /* No standard deviation multiplier needed. */
         for( i=0; i < (int)VALUE_HANDLE_DEREF(outNBElement); i++ )
         {
            tempReal  = tempBuffer2[i];
            tempReal2 = outRealMiddleBand[i];
            outRealUpperBand[i] = tempReal2 + tempReal;
            outRealLowerBand[i] = tempReal2 - tempReal;
         }
      }
      else
      {
         /* Upper/lower band use the same standard deviation multiplier. */
         for( i=0; i < (int)VALUE_HANDLE_DEREF(outNBElement); i++ )
         {
            tempReal  = tempBuffer2[i] * optInNbDevUp;
            tempReal2 = outRealMiddleBand[i];
            outRealUpperBand[i] = tempReal2 + tempReal;
            outRealLowerBand[i] = tempReal2 - tempReal;
         }
      }
   }
   else if( optInNbDevUp == 1.0 )
   {
      /* Only lower band has a standard deviation multiplier. */
      for( i=0; i < (int)VALUE_HANDLE_DEREF(outNBElement); i++ )
      {
         tempReal  = tempBuffer2[i];
         tempReal2 = outRealMiddleBand[i];
         outRealUpperBand[i] = tempReal2 + tempReal;
         outRealLowerBand[i] = tempReal2 - (tempReal * optInNbDevDn);
      }
   }
   else if( optInNbDevDn == 1.0 )
   {
      /* Only upper band has a standard deviation multiplier. */
      for( i=0; i < (int)VALUE_HANDLE_DEREF(outNBElement); i++ )
      {
         tempReal  = tempBuffer2[i];
         tempReal2 = outRealMiddleBand[i];
         outRealLowerBand[i] = tempReal2 - tempReal;
         outRealUpperBand[i] = tempReal2 + (tempReal * optInNbDevUp);
      }
   }
   else
   {
      /* Upper/lower band have distinctive standard deviation multiplier. */
      for( i=0; i < (int)VALUE_HANDLE_DEREF(outNBElement); i++ )
      {
         tempReal  = tempBuffer2[i];
         tempReal2 = outRealMiddleBand[i];
         outRealUpperBand[i] = tempReal2 + (tempReal * optInNbDevUp);
         outRealLowerBand[i] = tempReal2 - (tempReal * optInNbDevDn);
      }
   }
   
   return ENUM_VALUE(RetCode,TA_SUCCESS,Success);
}

/**** START GENCODE SECTION 5 - DO NOT DELETE THIS LINE ****/
/* Generated */ 
/* Generated */ #define  USE_SINGLE_PRECISION_INPUT
/* Generated */ #if !defined( _MANAGED ) && !defined( _JAVA )
/* Generated */    #undef   TA_PREFIX
/* Generated */    #define  TA_PREFIX(x) TA_S_##x
/* Generated */ #endif
/* Generated */ #undef   INPUT_TYPE
/* Generated */ #define  INPUT_TYPE float
/* Generated */ #if defined( _MANAGED )
/* Generated */ enum class Core::RetCode Core::Bbands( int    startIdx,
/* Generated */                                        int    endIdx,
/* Generated */                                        cli::array<float>^ inReal,
/* Generated */                                        int           optInTimePeriod, /* From 2 to 100000 */
/* Generated */                                        double        optInNbDevUp, /* From TA_REAL_MIN to TA_REAL_MAX */
/* Generated */                                        double        optInNbDevDn, /* From TA_REAL_MIN to TA_REAL_MAX */
/* Generated */                                        MAType        optInMAType,
/* Generated */                                        [Out]int%    outBegIdx,
/* Generated */                                        [Out]int%    outNBElement,
/* Generated */                                        cli::array<double>^  outRealUpperBand,
/* Generated */                                        cli::array<double>^  outRealMiddleBand,
/* Generated */                                        cli::array<double>^  outRealLowerBand )
/* Generated */ #elif defined( _JAVA )
/* Generated */ public RetCode bbands( int    startIdx,
/* Generated */                        int    endIdx,
/* Generated */                        float        inReal[],
/* Generated */                        int           optInTimePeriod, /* From 2 to 100000 */
/* Generated */                        double        optInNbDevUp, /* From TA_REAL_MIN to TA_REAL_MAX */
/* Generated */                        double        optInNbDevDn, /* From TA_REAL_MIN to TA_REAL_MAX */
/* Generated */                        MAType        optInMAType,
/* Generated */                        MInteger     outBegIdx,
/* Generated */                        MInteger     outNBElement,
/* Generated */                        double        outRealUpperBand[],
/* Generated */                        double        outRealMiddleBand[],
/* Generated */                        double        outRealLowerBand[] )
/* Generated */ #else
/* Generated */ TA_RetCode TA_S_BBANDS( int    startIdx,
/* Generated */                         int    endIdx,
/* Generated */                         const float  inReal[],
/* Generated */                         int           optInTimePeriod, /* From 2 to 100000 */
/* Generated */                         double        optInNbDevUp, /* From TA_REAL_MIN to TA_REAL_MAX */
/* Generated */                         double        optInNbDevDn, /* From TA_REAL_MIN to TA_REAL_MAX */
/* Generated */                         TA_MAType     optInMAType,
/* Generated */                         int          *outBegIdx,
/* Generated */                         int          *outNBElement,
/* Generated */                         double        outRealUpperBand[],
/* Generated */                         double        outRealMiddleBand[],
/* Generated */                         double        outRealLowerBand[] )
/* Generated */ #endif
/* Generated */ {
/* Generated */    ENUM_DECLARATION(RetCode) retCode;
/* Generated */    int i;
/* Generated */    double tempReal, tempReal2;
/* Generated */    ARRAY_REF(tempBuffer1);
/* Generated */    ARRAY_REF(tempBuffer2);
/* Generated */  #ifndef TA_FUNC_NO_RANGE_CHECK
/* Generated */     if( startIdx < 0 )
/* Generated */        return ENUM_VALUE(RetCode,TA_OUT_OF_RANGE_START_INDEX,OutOfRangeStartIndex);
/* Generated */     if( (endIdx < 0) || (endIdx < startIdx))
/* Generated */        return ENUM_VALUE(RetCode,TA_OUT_OF_RANGE_END_INDEX,OutOfRangeEndIndex);
/* Generated */     #if !defined(_JAVA)
/* Generated */     if( !inReal ) return ENUM_VALUE(RetCode,TA_BAD_PARAM,BadParam);
/* Generated */     #endif 
/* Generated */     if( (int)optInTimePeriod == TA_INTEGER_DEFAULT )
/* Generated */        optInTimePeriod = 5;
/* Generated */     else if( ((int)optInTimePeriod < 2) || ((int)optInTimePeriod > 100000) )
/* Generated */        return ENUM_VALUE(RetCode,TA_BAD_PARAM,BadParam);
/* Generated */     if( optInNbDevUp == TA_REAL_DEFAULT )
/* Generated */        optInNbDevUp = 2.000000e+0;
/* Generated */     else if( (optInNbDevUp < -3.000000e+37) ||  (optInNbDevUp > 3.000000e+37) )
/* Generated */        return ENUM_VALUE(RetCode,TA_BAD_PARAM,BadParam);
/* Generated */     if( optInNbDevDn == TA_REAL_DEFAULT )
/* Generated */        optInNbDevDn = 2.000000e+0;
/* Generated */     else if( (optInNbDevDn < -3.000000e+37) ||  (optInNbDevDn > 3.000000e+37) )
/* Generated */        return ENUM_VALUE(RetCode,TA_BAD_PARAM,BadParam);
/* Generated */     #if !defined(_MANAGED) && !defined(_JAVA)
/* Generated */     if( (int)optInMAType == TA_INTEGER_DEFAULT )
/* Generated */        optInMAType = (TA_MAType)0;
/* Generated */     else if( ((int)optInMAType < 0) || ((int)optInMAType > 8) )
/* Generated */        return ENUM_VALUE(RetCode,TA_BAD_PARAM,BadParam);
/* Generated */     #endif 
/* Generated */     #if !defined(_JAVA)
/* Generated */     if( !outRealUpperBand )
/* Generated */        return ENUM_VALUE(RetCode,TA_BAD_PARAM,BadParam);
/* Generated */     if( !outRealMiddleBand )
/* Generated */        return ENUM_VALUE(RetCode,TA_BAD_PARAM,BadParam);
/* Generated */     if( !outRealLowerBand )
/* Generated */        return ENUM_VALUE(RetCode,TA_BAD_PARAM,BadParam);
/* Generated */     #endif 
/* Generated */  #endif 
/* Generated */    #if defined(USE_SINGLE_PRECISION_INPUT) || defined( USE_SUBARRAY )
/* Generated */       tempBuffer1 = outRealMiddleBand;
/* Generated */       tempBuffer2 = outRealLowerBand;
/* Generated */    #else
/* Generated */       if( inReal == outRealUpperBand )
/* Generated */       {
/* Generated */          tempBuffer1 = outRealMiddleBand;
/* Generated */          tempBuffer2 = outRealLowerBand;
/* Generated */       }
/* Generated */       else if( inReal == outRealLowerBand )
/* Generated */       {
/* Generated */          tempBuffer1 = outRealMiddleBand;
/* Generated */          tempBuffer2 = outRealUpperBand;
/* Generated */       }
/* Generated */       else if( inReal == outRealMiddleBand )
/* Generated */       {
/* Generated */          tempBuffer1 = outRealLowerBand;
/* Generated */          tempBuffer2 = outRealUpperBand;
/* Generated */       }
/* Generated */       else
/* Generated */       {
/* Generated */          tempBuffer1 = outRealMiddleBand;
/* Generated */          tempBuffer2 = outRealUpperBand;
/* Generated */       }
/* Generated */       if( (tempBuffer1 == inReal) || (tempBuffer2 == inReal) )
/* Generated */          return ENUM_VALUE(RetCode,TA_BAD_PARAM,BadParam);
/* Generated */    #endif
/* Generated */    retCode = FUNCTION_CALL(MA)( startIdx, endIdx, inReal,
/* Generated */                                 optInTimePeriod, optInMAType,
/* Generated */                                 outBegIdx, outNBElement, tempBuffer1 );
/* Generated */    if( (retCode != ENUM_VALUE(RetCode,TA_SUCCESS,Success) ) || ((int)VALUE_HANDLE_DEREF(outNBElement) == 0) )
/* Generated */    {
/* Generated */       VALUE_HANDLE_DEREF_TO_ZERO(outNBElement);
/* Generated */       return retCode;
/* Generated */    }
/* Generated */    if( optInMAType == ENUM_VALUE(MAType,TA_MAType_SMA,Sma) )
/* Generated */    {
/* Generated */        FUNCTION_CALL(INT_stddev_using_precalc_ma)( inReal, tempBuffer1, 
/* Generated */                                                    (int)VALUE_HANDLE_DEREF(outBegIdx), (int)VALUE_HANDLE_DEREF(outNBElement),
/* Generated */                                                    optInTimePeriod, tempBuffer2 );
/* Generated */    }
/* Generated */    else
/* Generated */    {
/* Generated */       retCode = FUNCTION_CALL(STDDEV)( (int)VALUE_HANDLE_DEREF(outBegIdx), endIdx, inReal,
/* Generated */                                        optInTimePeriod, 1.0,
/* Generated */                                        outBegIdx, outNBElement, tempBuffer2 );
/* Generated */       if( retCode != ENUM_VALUE(RetCode,TA_SUCCESS,Success) )
/* Generated */       {
/* Generated */          VALUE_HANDLE_DEREF_TO_ZERO(outNBElement);
/* Generated */          return retCode;
/* Generated */       }
/* Generated */    }
/* Generated */    #if !defined(USE_SINGLE_PRECISION_INPUT)
/* Generated */       if( tempBuffer1 != outRealMiddleBand )
/* Generated */       {
/* Generated */          ARRAY_COPY( outRealMiddleBand, tempBuffer1, VALUE_HANDLE_DEREF(outNBElement) );
/* Generated */       }
/* Generated */    #endif
/* Generated */    if( optInNbDevUp == optInNbDevDn )
/* Generated */    {
/* Generated */       if(  optInNbDevUp == 1.0 )
/* Generated */       {
/* Generated */          for( i=0; i < (int)VALUE_HANDLE_DEREF(outNBElement); i++ )
/* Generated */          {
/* Generated */             tempReal  = tempBuffer2[i];
/* Generated */             tempReal2 = outRealMiddleBand[i];
/* Generated */             outRealUpperBand[i] = tempReal2 + tempReal;
/* Generated */             outRealLowerBand[i] = tempReal2 - tempReal;
/* Generated */          }
/* Generated */       }
/* Generated */       else
/* Generated */       {
/* Generated */          for( i=0; i < (int)VALUE_HANDLE_DEREF(outNBElement); i++ )
/* Generated */          {
/* Generated */             tempReal  = tempBuffer2[i] * optInNbDevUp;
/* Generated */             tempReal2 = outRealMiddleBand[i];
/* Generated */             outRealUpperBand[i] = tempReal2 + tempReal;
/* Generated */             outRealLowerBand[i] = tempReal2 - tempReal;
/* Generated */          }
/* Generated */       }
/* Generated */    }
/* Generated */    else if( optInNbDevUp == 1.0 )
/* Generated */    {
/* Generated */       for( i=0; i < (int)VALUE_HANDLE_DEREF(outNBElement); i++ )
/* Generated */       {
/* Generated */          tempReal  = tempBuffer2[i];
/* Generated */          tempReal2 = outRealMiddleBand[i];
/* Generated */          outRealUpperBand[i] = tempReal2 + tempReal;
/* Generated */          outRealLowerBand[i] = tempReal2 - (tempReal * optInNbDevDn);
/* Generated */       }
/* Generated */    }
/* Generated */    else if( optInNbDevDn == 1.0 )
/* Generated */    {
/* Generated */       for( i=0; i < (int)VALUE_HANDLE_DEREF(outNBElement); i++ )
/* Generated */       {
/* Generated */          tempReal  = tempBuffer2[i];
/* Generated */          tempReal2 = outRealMiddleBand[i];
/* Generated */          outRealLowerBand[i] = tempReal2 - tempReal;
/* Generated */          outRealUpperBand[i] = tempReal2 + (tempReal * optInNbDevUp);
/* Generated */       }
/* Generated */    }
/* Generated */    else
/* Generated */    {
/* Generated */       for( i=0; i < (int)VALUE_HANDLE_DEREF(outNBElement); i++ )
/* Generated */       {
/* Generated */          tempReal  = tempBuffer2[i];
/* Generated */          tempReal2 = outRealMiddleBand[i];
/* Generated */          outRealUpperBand[i] = tempReal2 + (tempReal * optInNbDevUp);
/* Generated */          outRealLowerBand[i] = tempReal2 - (tempReal * optInNbDevDn);
/* Generated */       }
/* Generated */    }
/* Generated */    return ENUM_VALUE(RetCode,TA_SUCCESS,Success);
/* Generated */ }
/* Generated */ 
/* Generated */ #if defined( _MANAGED )
/* Generated */ }}} // Close namespace TicTacTec.TA.Lib
/* Generated */ #endif
/**** END GENCODE SECTION 5 - DO NOT DELETE THIS LINE ****/


```


# BOP

Overview of the Balance of Power calculation.

## BOP

The Balance of Power indicator (BOP) measures the strength of buyers have to push prices higher against the power of sellers to move prices lower. When the indicator is in positive territory, the bulls are in charge; and conversely, the sellers control price when the indicator is negative. A reading near the zero line indicates a balance between the two and a possible trend reversal.

```
  /* BOP = (Close - Open)/(High - Low) */
```

The source code for the BOP function is available [here](https://app.optionalpha.com/ta/BOP.txt).\
\
Some trading platforms offer a version of BOP with a moving average added and others do not.\
\
We offer Balance of Power exactly as TA-Lib provides **without a moving average**. As a result, when using BOP inside of your bots, there will be no difference in the value provided when assessing different lookback intervals.

![](https://2799944806-files.gitbook.io/~/files/v0/b/gitbook-x-prod.appspot.com/o/spaces%2F-MYjluAVRcRcfh1YL43z%2Fuploads%2FP5sYObs1RXTNfpvZQEOh%2FBalance%20Of%20Power.png?alt=media\&token=a2c5c4c7-336e-466d-9e0b-bc1d9c7306b7)


# CCI

Overview of the Commodity Channel Index calculation.

## CCI

The Commodity Channel Index​ (CCI) is a momentum-based oscillator used to help determine when an investment vehicle is reaching a condition of being overbought or oversold. This technical indicator measures the difference between the current price and the historical average. It assesses trend direction and strength, allowing traders to determine if they want to enter, exit, or avoid placing a trade.

The source code for the CCI function is available [here](https://app.optionalpha.com/ta/CCI.txt).

```
/* Return CCI (Commodity Chanel Index) for n bars close price.
 *​
 * CCI = (Typical Price − MA) / 0.015 * Mean Deviation
 *
 * where:
 *     Typical Price = ∑P((H + L + C) / 3))
 *     P = number of bars (period)
 *     MA = Moving Average = (∑P Typical Price) / P
 *     Mean Deviation=(∑P | Typical Price - MA |) / P
 */
```


# CMO

Overview of the Chande Momentum Oscillator calculation.

## CMO

The Chande momentum oscillator is a technical momentum developed by Tushar Chande. His formula calculates the difference between the sum of recent gains and the sum of recent losses and then divides the result by the sum of all price movements over the same time period.

The indicator oscillates between +100 and -100 and is similar to other momentum indicators such as Welles Wilder’s RSI. It measures momentum on both up and down days and does not smooth results. This method triggers more frequent oversold and overbought occurrences.

An instrument is considered to be overbought when the Chande momentum oscillator is above +50 and oversold when it is below -50. The oscillator can be used as a confirmation signal when it crosses above or below the 0 line. Trend strength can also be measured using the CMO as the oscillator's value denotes the strength or weakness of the expected trend. Bear in mind that the chosen time frame will affect the signals generated by the indicator.

The source code for the CMO function is available [here](https://app.optionalpha.com/ta/CMO.txt).

```
/* CMO calculation is mostly identical to RSI.
 * 
 * The only difference is in the last step of calculation:
 *
 *   RSI = gain / (gain+loss)
 *   CMO = (gain-loss) / (gain+loss)
 * 
 * See the RSI function for potentially some more info 
 * on this algo.
 */
```


# DX

Overview of the Directional Index calculation.

## DX

The directional movement index (DX) is an indicator that identifies which direction the price of an asset is moving. The DX indicator is generally part of the Directional Movement Index (DMI)\
The indicator functions by comparing prior highs and lows and drawing two lines. A negative directional movement line (-DI) and a positive directional movement line (+DI). An optional third line called the Directional Index (DX) or sometimes Average Directional Index (ADX) can also be used to gauge the strength of the uptrend or downtrend.

The source code for the DX function is available [here](https://app.optionalpha.com/ta/DX.txt).

```
/* 
 * The DM1 (one period) is base on the largest part of
 * today's range that is outside of yesterdays range.
 * 
 * The following 7 cases explain how the +DM and -DM are
 * calculated on one period:
 *
 * Case 1:                       Case 2:
 *    C|                        A|
 *     |                         | C|
 *     | +DM1 = (C-A)           B|  | +DM1 = 0
 *     | -DM1 = 0                   | -DM1 = (B-D)
 * A|  |                           D| 
 *  | D|                    
 * B|
 *
 * Case 3:                       Case 4:
 *    C|                           C|
 *     |                        A|  |
 *     | +DM1 = (C-A)            |  | +DM1 = 0
 *     | -DM1 = 0               B|  | -DM1 = (B-D)
 * A|  |                            | 
 *  |  |                           D|
 * B|  |
 *    D|
 * 
 * Case 5:                      Case 6:
 * A|                           A| C|
 *  | C| +DM1 = 0                |  |  +DM1 = 0
 *  |  | -DM1 = 0                |  |  -DM1 = 0
 *  | D|                         |  |
 * B|                           B| D|
 *
 *
 * Case 7:
 * 
 *    C|
 * A|  |
 *  |  | +DM=0
 * B|  | -DM=0
 *    D|
 *
 * In case 3 and 4, the rule is that the smallest delta between
 * (C-A) and (B-D) determine which of +DM or -DM is zero.
 *
 * In case 7, (C-A) and (B-D) are equal, so both +DM and -DM are
 * zero.
 *
 * The rules remain the same when A=B and C=D (when the highs
 * equal the lows).
 *
 * When calculating the DM over a period > 1, the one-period DM
 * for the desired period are initialy sum. In other word, 
 * for a -DM14, sum the -DM1 for the first 14 days (that's 
 * 13 values because there is no DM for the first day!)
 * Subsequent DM are calculated using the Wilder's
 * smoothing approach:
 * 
 *                                    Previous -DM14
 *  Today's -DM14 = Previous -DM14 -  -------------- + Today's -DM1
 *                                         14
 *
 * Calculation of a -DI14 is as follow:
 * 
 *               -DM14
 *     -DI14 =  --------
 *                TR14
 *
 * Calculation of the TR14 is:
 *
 *                                   Previous TR14
 *    Today's TR14 = Previous TR14 - -------------- + Today's TR1
 *                                         14
 *
 *    The first TR14 is the summation of the first 14 TR1. See the
 *    TA_TRANGE function on how to calculate the true range.
 *
 * Calculation of the DX14 is:
 *    
 *    diffDI = ABS( (-DI14) - (+DI14) )
 *    sumDI  = (-DI14) + (+DI14)
 *
 *    DX14 = 100 * (diffDI / sumDI)
 *
 * Reference:
 *    New Concepts In Technical Trading Systems, J. Welles Wilder Jr
 */
```


# EMA

Overview of the Exponential Moving Average indicator.

## EMA

An exponential moving average (EMA) is the weighted average of a set of data points where new data points receive greater weight in the average calculation. An exponential moving average is a technical indicator of a trend that responds faster to new data points than a simple moving average because a multiplier is used to give preference to the new data points and reduce lag in responsiveness to price movements.

The source code for the EMA function is available [here](https://app.optionalpha.com/ta/EMA.txt).


# GEX

Gamma exposure charts specific to each expiration date are available in the Option Alpha platform for all supported ticker symbols.

### What is Gamma Exposure (GEX)?

Gamma is an option greek that measures the rate at which the delta for an option contract will change based on +/- $1 change in the underlying price. Since market makers seek to maintain a delta neutral (delta = 0) portfolio, gamma "exposure" gives insight into specific strikes where there is a high amount of gamma that could cause market makers to re-hedge to maintain a delta neutral portfolio. This insight can help traders make timely trades in anticipation of predictable price action.&#x20;

The charts in Option Alpha calculate gamma exposure (GEX) based on a +/- 1% move in the underlying price.

### **Call vs Put**

The 'Call vs Put' view displays the direct call vs put GEX to highlight the amount of call strike and put strike gamma exposure, open interest and volume for each strike price.

The green bars represent call GEX and the red bars put GEX.

### Absolute Gamma

Absolute Gamma is total Gamma for a strike price calculated by summing the positive call gex and negative put gex into 1 positive gex value.&#x20;

For example, if there is 9.6b call gamma exposure and -1b put gamma exposure, the absolute gamma is 10.6b.

![](https://option-alpha.s3.amazonaws.com/uploads/175493370211213370581.png)

### Net Gamma Exposure

Net Gamma Exposure shows the combined total of positive call gex and negative put gex.

For example, if there is 9.6b call gamma exposure and -1b put gamma exposure, the net GEX is 8.6b.

### Daily Volume (background chart colors)

The orange shading shows the total put volume for the day; the blue shading shows total call volume for the day. Grey is where they overlap.

### GEX Ratio

The GEX ratio is the ratio of negative to positive gamma exposure, and it flips based on current ratio. It only includes displayed bars so it can be adjusted for only closest to the current price.

{% hint style="info" %}
**Example**:\
2b neg and 3b pos = 3b / 2b = 1.5x positive to negative GEX ratio (green)\
3b neg and 2b pos = -3b / 2b = -1.5x negative to positive GEX ratio (red)
{% endhint %}

### GEX Sentiment

GEX sentiment is the % of bars nearest to the current price that are positive.

In this chart, there is 8.2 times as much negative gamma as positive and only 43% of the included bars are positive:

![](https://option-alpha.s3.amazonaws.com/uploads/175493350775516773171.png)

In this chart, there is 6.5x as much positive gamma as negative and 55% of 40 bars nearest the money are positive with a net total gamma of 14.6b:

![](https://option-alpha.s3.amazonaws.com/uploads/175493351292912099411.png)

### How to leverage GEX as a trader?

For more information about how we use gamma exposure to trade, check out this [**Gamma Exposure playlist**](https://www.youtube.com/playlist?list=PLhKnvfWKsu413dNhE8LrDNLlGL61bhwFt) on YouTube.&#x20;


# KAMA

Overview of the Kaufman Adaptive Moving Average indicator.

## KAMA

The Kaufman Adaptive Moving Average (KAMA) indicator belongs to the group of adaptive moving averages. Like all moving averages, the KAMA can be used to visualize the trend. This powerful trend-following indicator is based around the Exponential Moving Average (EMA) and is responsive to both trend and volatility. It closely follows price when noise is low and attempts to smooth out market noise when price fluctuates.

The source code for the KAMA function is available [here](https://app.optionalpha.com/ta/KAMA.txt).


# MACD

Overview of the Moving Average Convergence Divergence indicator.

## MACD

The [moving average convergence/divergence (MACD)](https://optionalpha.com/analysis/technical-indicators#macd) is a technical indicator of [momentum](https://optionalpha.com/analysis/momentum-trend) that uses moving averages to determine a trend’s strength. The MACD uses three exponential moving averages (a short term, a long term, and the average difference between the short and long term) to show price momentum.

The source code for the MACD function is found [here.](https://app.optionalpha.com/ta/MACD.txt)


# MFI

Overview of the Money Flow Index indicator.

## MFI

The Money Flow Index (MFI) is a technical indicator that generates overbought or oversold signals using both price and volume data. An MFI reading above 80 is considered overbought and an MFI reading below 20 is considered oversold. MFI levels of 90 and 10 are also used as thresholds.

The source code for the MFI function is available [here](https://app.optionalpha.com/ta/MFI.txt).


# MOM

Overview of the Momentum indicator.

## MOM

The Momentum Indicator (MOM) is a leading indicator measuring a security's rate of change. It compares the current price with the previous price from a number of periods ago. The plot forms an oscillator that moves above and below 0. It is an unbounded oscillator with no lower or upper limit.

The source code for the MOM function is available [here](https://app.optionalpha.com/ta/MOM.txt).


# ROC

Overview of the Rate of Change calculation.

## ROC

Rate of change (ROC) is a technical indicator of momentum that measures the percentage change in price from period to period. Rate of change is also referred to as “momentum” and is often used to confirm trends. For example, when a security reaches a new high but the rate of change does not, then there is a negative divergence between price and momentum.

The source code for the ROC function is available [here](https://app.optionalpha.com/ta/ROC.txt).

```
/* The interpretation of the rate of change varies widely depending
 * which software and/or books you are refering to.
 *
 * The following is the table of Rate-Of-Change implemented in TA-LIB:
 *       MOM     = (price - prevPrice)         [Momentum]
 *       ROC     = ((price/prevPrice)-1)*100   [Rate of change]
 *       ROCP    = (price-prevPrice)/prevPrice [Rate of change Percentage]
 *       ROCR    = (price/prevPrice)           [Rate of change ratio]
 *       ROCR100 = (price/prevPrice)*100       [Rate of change ratio 100 Scale]
 *
 * Here are the equivalent function in other software:
 *       TA-Lib  |   Tradestation   |    Metastock         
 *       =================================================
 *       MOM     |   Momentum       |    ROC (Point)
 *       ROC     |   ROC            |    ROC (Percent)
 *       ROCP    |   PercentChange  |    -     
 *       ROCR    |   -              |    -
 *       ROCR100 |   -              |    MO
 *
 * The MOM function is the only one who is not normalized, and thus
 * should be avoided for comparing different time serie of prices.
 * 
 * ROC and ROCP are centered at zero and can have positive and negative
 * value. Here are some equivalence:
 *    ROC = ROCP/100 
 *        = ((price-prevPrice)/prevPrice)/100
 *        = ((price/prevPrice)-1)*100
 *
 * ROCR and ROCR100 are ratio respectively centered at 1 and 100 and are
 * always positive values.
 */
```


# RSI

Overview of the Relative Strength Index calculation.

## RSI

The relative strength index (RSI) is a technical indicator of momentum that measures the speed and change of price on a scale of 0 to 100, typically over the past 14 periods. Readings over 70 are considered overbought while readings below 30 are considered oversold.

The source code for the RSI function is available [here](https://app.optionalpha.com/ta/RSI.txt).

```
/* Often documentation present the RSI calculation as follow:
 *    RSI = 100 - (100 / 1 + (prevGain/prevLoss))
 *
 * The following is equivalent:
 *    RSI = 100 * (prevGain/(prevGain+prevLoss))
 *
 * The second equation is used here for speed optimization.
 */
```

<br>


# SMA

Overview of the Simple Moving Average indicator.

## SMA

A simple moving average (SMA) is an arithmetic average of a set of data points where each data point is added together and then divided by the total number of data points. For example, a 10-period simple moving average finds the closing price of the last 10-periods, sums the 10 closing prices, and divides by 10 to calculate the average closing price of the previous 10 periods. New periods are then added to the calculation and the oldest period is deleted from the calculation.

The source code for the SMA function is available [here](https://app.optionalpha.com/ta/SMA.txt).


# STOCH

Overview of the Stochastic Oscillator Indicator.

## STOCH

The [stochastic oscillator](https://optionalpha.com/analysis/technical-indicators#stochastic-oscillator) is a technical indicator of momentum that shows where the closing price for a period fits in the relative high-low range of a lookback period, typically 14 periods.

The stochastic oscillator expresses the closing price for a period as a percentage of the recent high and low for a security. The most recent closing price is the most important data point in the calculation.

The stochastic oscillator is plotted as two lines. The first line is the current stochastic oscillator percentage value, and the second line is a three-day simple moving average of the percentage value. These are known as %K and %D, respectively.

Source code for the Stochastic Oscillator function is available [here.](https://app.optionalpha.com/ta/STOCH.txt)


# STOCH RSI

Overview of the Stochastic RSI Indicator.

## Stoch RSI

**The Stochastic RSI (StochRSI)** is an indicator that ranges between zero and 100 and is created by applying the Stochastic oscillator formula to a set of relative strength index (RSI) values rather than to standard price data. Using RSI values within the Stochastic formula gives traders an idea of whether the current RSI value is overbought or oversold.

<br>


# TRIMA

Overview of the Triangular Moving Average calculation.

## TRIMA

The Triangular Moving Average (TRIMA) represents an average of prices but places weight on the middle prices of the time period. The calculations double-smooths the data using a window width that is one-half the length of the series.

The source code for the TRIMA function is available [here](https://app.optionalpha.com/ta/TRIMA.txt).

```
/* TRIMA Description
 * =================
 * The triangular MA is a weighted moving average. Instead of the
 * TA_WMA who put more weigth on the latest price bar, the triangular
 * put more weigth on the data in the middle of the specified period.
 *
 * Examples:
 *   For TimeSerie={a,b,c,d,e,f...} ('a' is the older price)
 *
 *   1st value for TRIMA 4-Period is:  ((1*a)+(2*b)+(2*c)+(1*d)) / 6
 *   2nd value for TRIMA 4-Period is:  ((1*b)+(2*c)+(2*d)+(1*e)) / 6
 *
 *   1st value for TRIMA 5-Period is:  ((1*a)+(2*b)+(3*c)+(2*d)+(1*e)) / 9
 *   2nd value for TRIMA 5-Period is:  ((1*b)+(2*c)+(3*d)+(2*e)+(1*f)) / 9
 *
 * Generally Accepted Implementation
 * ==================================
 * Using algebra, it can be demonstrated that the TRIMA is equivalent to
 * doing a SMA of a SMA. The following explain the rules:
 *
 *  (1) When the period is even, TRIMA(x,period)=SMA(SMA(x,period/2),(period/2)+1)
 *  (2) When the period is odd,  TRIMA(x,period)=SMA(SMA(x,(period+1)/2),(period+1)/2)
 *
 * In other words:
 *  (1) A period of 4 becomes TRIMA(x,4) = SMA( SMA( x, 2), 3 )
 *  (2) A period of 5 becomes TRIMA(x,5) = SMA( SMA( x, 3), 3 )
 *
 * The SMA of a SMA is the algorithm generaly found in books.
 *
 * Tradestation Implementation
 * ===========================
 * Tradestation deviate from the generally accepted implementation by
 * making the TRIMA to be as follow:
 *    TRIMA(x,period) = SMA( SMA( x, (int)(period/2)+1), (int)(period/2)+1 );
 * This formula is done regardless if the period is even or odd.
 *
 * In other word:
 *  (1) A period of 4 becomes TRIMA(x,4) = SMA( SMA( x, 3), 3 )
 *  (2) A period of 5 becomes TRIMA(x,5) = SMA( SMA( x, 3), 3 )
 *  (3) A period of 6 becomes TRIMA(x,5) = SMA( SMA( x, 4), 4 )
 *  (4) A period of 7 becomes TRIMA(x,5) = SMA( SMA( x, 4), 4 )
 *
 * It is not clear to me if the Tradestation approach is a bug or a deliberate
 * decision to do things differently.
 *    
 * Metastock Implementation
 * ========================
 * Output is the same as the generally accepted implementation.
 *
 * TA-Lib Implementation
 * =====================
 * Output is also the same as the generally accepted implementation.
 *
 * For speed optimization and avoid memory allocation, TA-Lib use
 * a better algorithm than the usual SMA of a SMA.
 *
 * The calculation from one TRIMA value to the next is done by doing 4
 * little adjustment (the following show a TRIMA 4-period):
 *
 * TRIMA at time 'd': ((1*a)+(2*b)+(2*c)+(1*d)) / 6
 * TRIMA at time 'e': ((1*b)+(2*c)+(2*d)+(1*e)) / 6
 * 
 * To go from TRIMA 'd' to 'e', the following is done:
 *       1) 'a' and 'b' are substract from the numerator.
 *       2) 'd' is added to the numerator.
 *       3) 'e' is added to the numerator.
 *       4) Calculate TRIMA by doing numerator / 6
 *       5) Repeat sequence for next output
 *
 * These operations are the same steps done by TA-LIB:
 *       1) is done by numeratorSub
 *       2) is done by numeratorAdd.
 *       3) is obtain from the latest input
 *       4) Calculate and write TRIMA in the output
 *       5) Repeat for next output.
 *
 * Of course, numerotrAdd and numeratorSub needs to be
 * adjusted for each iteration.
 *
 * The update of numeratorSub needs values from the input at
 * the trailingIdx and middleIdx position.
 *
 * The update of numeratorAdd needs values from the input at
 * the middleIdx and todayIdx.
 */
```


# ULTIMATE OSCILLATOR

Overview of the Ultimate Oscillator Indicator.

## ULTIMATE OSCILLATOR

**The Ultimate Oscillator** was developed by Larry Williams in 1976 to measure the price momentum of an asset across multiple timeframes. It uses the weighted averages of three different timeframes, which makes the indicator have less volatility and produce fewer trade signals compared to other oscillators that rely on a single timeframe.


# WILLIAMS %R

Overview of the Williams % R indicator.

## WILLIAMS %R

**Williams %R**, or Williams Percent Range, is a momentum indicator that moves between 0 and -100 and measures overbought and oversold levels. The indicator is very similar to the Stochastic oscillator and is generally used in the same way. It was developed by Larry Williams, and it compares a stock’s closing price to the high-low range over a specific period, typically 14 days or periods.


# FAQs

The answer vault is a collection of popular frequently asked questions about the Option Alpha platform functionality, including specific use cases and examples to help members.

### Why do I need a bot?

When you create a bot, it is assigned to an account (live or paper). This connection is permanent, and tells the bot to send orders to your live brokerage account, or simulate fills using the OA in-app paper trading engine.

A bot does a few things for you, even if you are not running automations. For example, when you are opening a position, the bot will try multiple prices between the bid/ask spread ([SmartPricing](https://docs.optionalpha.com/tools/bots/smartpricing)) and attempt to get the trade filled at the best possible price (instead of the usual cancel/replace order process). After the position is opened, the bot will monitor the position's [Exit Options](https://docs.optionalpha.com/tools/managing-positions/exit-options) looking for an opportunity to exit and execute a trade to close the position when its available (also executing SmartPricing settings there too).

Bots are also a great way to organize your  positions, making it easy to analyze the results of certain strategies.

### How do I turn a paper bot into a live bot?

A bot's account connection cannot be changed. To make a paper bot live, you'll need to [clone the bot](/tools/clone-bot-templates) and change the account type to connect it to a live brokerage account.

Click the ••• in the bot's top right corner and select 'Clone bot.'

<figure><img src="/files/dqrBrxPEIr8rg4YmU5Ps" alt=""><figcaption></figcaption></figure>

### Why didn't my order fill?

There is no way to 100% guarantee a fill in a live market. In a live market, each order requires a counterparty to take the other side of the trade. A position not filling will naturally happen when trading in a live market when there is no counterparty to fill your order and/or the price you are requesting is outside the range the market is willing to accept.

You may consider expanding the range of the bid/ask spread you're willing to let the bot work through (up to 100% or more). You may also try adjusting the SmartPricing speed.

When attempting to open or close a position, your bot works through the bid/ask spread based on your SmartPricing settings, automatically canceling and replacing unfilled orders. The final price in the sequence stays active as a limit order for **two minutes** and then cancels.

{% hint style="info" %}
[**Click here**](https://optionalpha.com/help/smartpricing) for more details about SmartPricing functionality.
{% endhint %}

### Why are my live and paper bot results different?

Paper trading bots simulate a fill based on the current market's live pricing, typically at or near the mid price (you can modify your SmartPricing settings to allow for more slippage to help generate more realistic results.

The most common reason that a paper bot's results differ from a live bot is the ability to fill orders, specifically profit taking or stop losses. Consider including pessimistic pricing in your entry/exit criteria, and think criticially about how a strategy is likely to perform in a live market (e.g., will an order fill for a far OTM 0DTE position right before the market closes?).

### Why didn't my position close when it had a profit?

[SmartPricing](/tools/bots/smartpricing) attempts to fill the trade by submitting orders from the mid price to a "final price." The final price is the worst price you are willing to accept to fill the trade.

The 2 controls you have over this functionality are the SmartPricing mode (e.g. Patient, Normal, Fast) and the "Final Price" (the worst price it should try). Both are typically set up in this screen:

![](https://option-alpha.s3.amazonaws.com/uploads/177314742986611668861.png)

However, the Profit Taking Exit Options are a special scenario. You don't need to set a "Final Price" because the final price is automatically set by the bot to a price that locks in profit you specified. It won't try a worse price that would result in profit less than your specified amount.

In case you are wondering why profit taking works this way:

If SmartPricing were to go beyond a final price that locks in your profit taking, the outcome can quickly flip a trade from winner to loser. For example, in your trade above, if i went further than $.91 traversing the bid/ask spread than 1) you would get less than the 30% profit taking you specified 2) if it went all the way to $0.48, profit taking being triggered could have resulted in an unexpected loss. Instead the bot will continue to retry until it can fill at a price that gets the specified profit taking.

### Can I backtest a bot?

Bots cannot be backtested, simply because they can include many variables that aren't included in the backtester.

### Why did my position close for a loss greater than my stop loss?

Stop losses and trailing stops do not guarantee that a position will close for that exact value. Markets move fast and just because your stop is hit doesn't mean you'll get out at the same price as the trigger level. Bots use the position's mid-price when evaluating returns. It is possible that your stop loss or trailing stop will trigger *after* the position's value has exceeded your value. The exit stop loss is only a threshold, which means it will begin the closing order sequence at or below the target loss. Second, price movements are discrete and "jumpy" - just because a position is at a 10% loss, doesn't mean it can't be at a 50% loss seconds from now. Even if a stop loss is triggered at or near the target, you may end up closing at a much worse price than you were expecting.

### What is the difference between a Decision Input, Automation Input, and Bot Input?

{% hint style="info" icon="medal" %}
(Thank you to community member [Robert DiNero](https://app.optionalpha.com/community/member/pachiraaquatica) for his contribution and help in [this post](https://app.optionalpha.com/community/posts/whats-the-difference-between-a-decisio-2026040221160)).
{% endhint %}

We frequently get questions about users changing values, but the bot doesn't recognize the new values. Most often, this is due to the user changing the Default Value instead of the Automation Input value. Here are the 5 types of inputs and how they are used.

{% hint style="warning" icon="question" %}
[See this help page for detailed information on using inputs](/tools/bots/inputs).
{% endhint %}

### Why are my bot results different than my broker?

{% hint style="info" icon="medal" %}
(Thank you to community member [Robert DiNero](https://app.optionalpha.com/community/member/pachiraaquatica) for his contribution and help in [this post](https://app.optionalpha.com/community/posts/whats-the-difference-between-a-decisio-2026040221160)).
{% endhint %}

Your open and close price values should always be the same in the platform and on your broker statement. The order details are shared exactly as they are executed. Open position unrealized P/L can differ because the broker may be calculating returns differently (e.g., OA uses the position's mid-price, while the broker may use the last price).

There are several reasons you might see differences between *closed* positions: 1) commissions and fees, 2) positions closed by the broker that are not updated in OA, 3) positions assigned that haven't been updated in OA, and 4) positions you've closed manually that haven't been updated in OA.

Check your broker's fees and commissions. Some will charge for assignment, and most charge a fee for index options. More details [here](https://optionalpha.com/integrations).

Bots aren't aware of any action taken outside the platform, so if you close a position (or your broker closes a position on your behalf), you'll need to update the position accordingly inside the OA platform.

The first thing you should do is make sure all your closed positions are actually closed.  If any say "override," then you need to update OA with the missing information.  Related to this point, check your settings to see how you have your ITM positions set up.  If they are set to override, then that could be a reason for the discrepancy. If a position is overrridden 10 minutes before the close, the bot won't know the actual closing value, for example.

![](https://option-alpha.s3.amazonaws.com/uploads/177629779211718904021.png)

Sometimes the broker will close positions to avoid risk. Usually if they close it before 4:00pm, you'll get an error in OA for a missing position that needs to be addressed.  If they close it between 4:00pm and 4:15pm then it will take a bit more work but you should look for any non-cash settled positions that are "expired" and double check them.  &#x20;

In addition, you should make sure that any assignments have been addressed in OA - so you'll want to check your statements for any lots of 100 that have been assigned.

While Option Alpha receives the trade prices from the broker and there shouldn't be any difference in prices, anything that happens through the broker after 4:00pm is not tracked.

### Why don't my bot trades match up exactly with the backtester?

Backtests are meant to simulate how a strategy would have performed using historical market data, while a bot trades in a live, constantly changing market. Because of that, it is not uncommon to experience some differences between backtested positions and live trades—even when the strategy settings are identical.

Live results and backtest results will never line up exactly long-term. And, this can go both ways: different results may be positive or negative to live P/L. Over a large enough sample size, these slight differences should hopefully balance out.

Here are some reasons to expect different results between backtest data and live trading:

* **A few seconds can matter** The backtester evaluates market data at the top of the minute requested in the position settings (e.g. an entry time scheduled for 10:00am EST looks at the underlying's price, option contract prices, strikes, etc at exactly 10:00am EST for each day in the backtest period). A live bot has to work through multiple decisions, select contracts, send the order, and receive a fill, which could result in small changes to the position's settings and/or pricing. In that time, prices may change slightly, sometimes in your favor and sometimes not.
* **Bid/ask prices fluctuate constantly** The backtester uses the position's mid-price at the time of entry. So, a backtest might simulate entering a position for a $12.40 credit, while the live market might experience a small but significant change in the bid/ask spread and pricing. Even a small price difference changes the position’s maximum profit, maximum loss, and eventual P/L.
* **Slippage settings** The backtester enables you to enter a slippage amount. Adding $0.10, for example, simply adds/subtracts $10 percontract from the backtested position's mid-price at entry and/or exit. However, the bot may fill at a different price (sometimes better than the slippage setting).
* **Live orders don't always fill** The backtest assumes entry based on the historical pricing available at that moment. A live bot must submit an order that another market participant is willing to fill. If the bot can't get its desired price, the position could fill at a different price—or not fill at all. Imagine an option is quoted $4.00 bid / $4.60 ask. There isn't one definitive "$4.30 price" at which you were guaranteed to trade. A historical assumption and a real order interacting with the market can produce different execution prices.
* **The exact contract selected can be different** If the strategy selects a .30 delta short put, the backtest may have found the 6,200 strike closest to .30 delta. In live trading, changing prices could make the 6,195 strike the closest match when the bot evaluates the position. The strategy rules are identical, but the actual position is different. For example, SPX underlying price changes multiple times per second. If you select $10 above the current price and it is on the edge, it could change the selected strike. And since SPX has minimum $5-wide strike intervals, that can shift the entire position up or down by at least $5.
* **Different entry prices can lead to different exit times** Say both positions have a 50% profit target. If the backtest enters a position for a $10.00 credit, its target is $5.00. If the live bot collects $9.50, its target is $4.75. One position might therefore close while the other remains open—even though both are following the same 50% profit-taking rule.
* **Scan time differences** The backtest scans one time and always fills if conditions are met. The bot is scanning a 15 minute window and has multiple opportunities to fill. That can create variance that can go (in your favor or against).
* **One small difference can create a chain reaction** This is especially important with a portfolio that has position limits or trade-frequency rules. If the backtest closes a position Tuesday but the live bot doesn't close it until Wednesday, the live bot might be unable to enter another Tuesday trade because it is still at its position limit. From there, the backtest and live portfolio can increasingly diverge.


# Day Trading

A collection of FAQs about day trading, 0DTE options, PDT rules, and everything you need to know to day trade with confidence.

### What is day trading?

Day trading is when you buy and sell a stock on the same trading day. Oftentimes, 'day traders' will execute multiple trades in a day and hold onto each position for only a short period of time.

### Is all options day trading 0DTE?

0DTE options expire the same day, so all 0DTE trades are executed as day trades, but not all day trades involve 0DTE contracts. Any option contract can be a day trade if opened and closed on the same day.

### Is day trading legal?

Yes, day trading is legal. However, you should check with your broker to ensure you have the correct account type and minimum funds to avoid the pattern day trading rule.

### What is 0DTE?

0DTE options, aka zero days to expiration, are option contracts that expire at the close of the day they are opened. Trading a 0DTE position means you entered the trade on the same day the contract expires, regardless of how long the contract has been available.

### What is pattern day trading (PDT)?

The PDT rule states that investors who make four or more day trades in a five-day period are considered pattern day traders and must maintain a minimum account balance of $25,000. Violating the PDT rule can result in your trading account being suspended by the broker.

### What is the difference between SPX and SPY?

SPX is an index option whose contracts derive their value from the S\&P 500 index. SPX is a European-style index option with cash-settlement and favorable 60/40 tax treatment. SPX cannot be traded like a stock; traders must use options to gain exposure.

SPY is an ETF (exchange-traded fund) that tracks the S\&P 500 but can be bought and sold and also has tradeable options. SPY is 1/10th the value of SPX. SPY is an American-style ETF with options that have physical settlement. Learn more about SPX vs SPY [here](https://optionalpha.com/learn/spx-vs-spy-how-to-trade-the-s-p-500).

<figure><img src="/files/CMnDZ6lEciGw5a2k3yLa" alt=""><figcaption></figcaption></figure>